Outperformance Persists for Solyco Wealth Model Portfolios through 3Q22
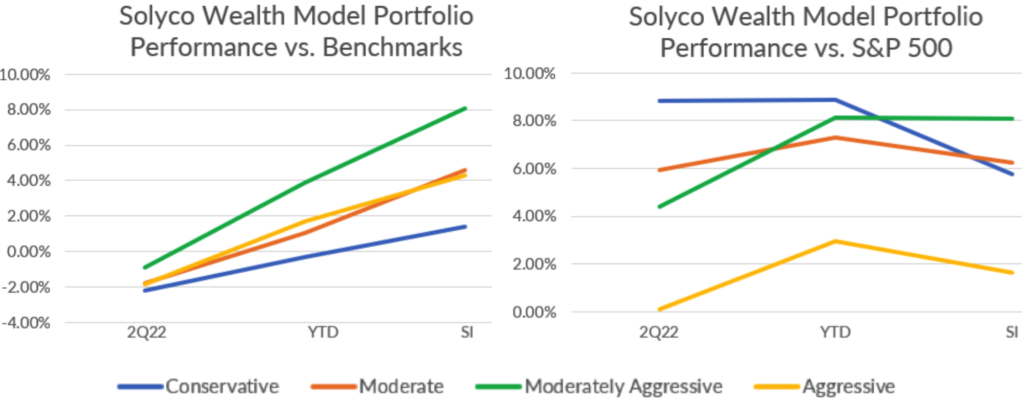
 Outperformance largely continued for the four model portfolios managed by Solyco Wealth in 3Q22, year-to-date in 2022 (YTD), and since inception (SI), as shown in the two graphs below. Unfortunately, with the head-fake of a recovery in risk-asset prices of July-August 2022 firmly in the rear-view mirror and the resumption of 1H22’s downward trajectory for assets prices, this outperformance translated to the four portfolios posting less negative total returns than their benchmarks and the major indices.
Across the portfolios prescient moves at end-2Q22 to add Deere & Co. [DE (+11.4% in 3Q22)] and Marathon Petroleum [MPC (+18.3% in 3Q22)] led performance for the quarter. Adding these positions produced a dual benefit as they replaced Technology positions that continued their declines over the course of the quarter. The DE and MPC moves higher, however, failed to offset the declines among Communication Services stocks Comcast [CMCSA (-24.9% in 3Q22)] and Paramount [PARA (-23.3% in 3Q22)], which were the worst performing securities across the portfolios last quarter.

As has been the case since the September 8, 2021, inception of Solyco Wealth’s model portfolios, stock-picking drove outperformance across all time frames. Unlike in 1H22, though, price dispersion across fixed income-related assets materialized in 3Q22. For instance, the SPDR Bloomberg High-Yield Bond ETF (SJNK) posted a +0.2% total return for the quarter. Thus, asset allocation, or the proportion of bonds versus stocks in the portfolios along with the choice of bond ETFs within the portfolios, contributed to outperformance for almost 80% of the 12 time-period observations across the four model portfolios.
Conservative Model Portfolio
The Conservative model portfolio, which offers a 65% allocation to fixed income securities, a 22.8% domestic equity securities allocation, a 2.2% international equity securities allocation, and a 10% cash position, after fees lost 4.2% for 3Q22, 14.5% year-to-date, and 12.9% since inception. The Conservative portfolio underweighted international equities since inception in order to overweight domestic equities. While the 3Q22 and since-inception performances outpaced the Conservative Model Portfolio’s benchmark after fees, YTD Conservative’s return lagged by a basis point.
| Solyco Wealth Conservative Model Portfolio Comparative Performance: 3Q22, YTD, and Since Inception | ||||
| 3Q22 | Year-to-Date | Since SW Inception | ||
| Benchmarks | S&P 500 | -5.70% | -23.87% | -19.38% |
| Russell 3000 | -5.35% | -24.62% | -21.34% | |
| MSCI All-World ex-US | -10.45% | -26.71% | -28.17% | |
| Bloomberg US Agg Bond | -4.34% | -14.50% | -15.07% | |
| Conservate Model Portfolio | Portfolio Return | -4.17% | -14.49% | -12.91% |
| Benchmark Return | -4.34% | -14.49% | -14.67% | |
| +/- Benchmark | 0.17% | -0.01% | 1.76% | |
| +/- S&P 500 | 1.53% | 9.37% | 6.46% | |
| +/- Equities vs. S&P 500 | -2.13% | 2.36% | 4.11% | |
| +/- Fixed Income vs. Agg | 1.26% | 1.61% | 2.71% | |
The above table reflects a 1% annual management fee, or 0.25% for 3Q22, 0.75% year-to-date through 9/30/2022, and 1.075% since exception.
Actual client investment performance likely will differ from respective model portfolio performance due to several factors including: 1) Timing of securities purchases and sales, 2) Dividend reinvestment choices, 3) Securities held outside the model portfolio, 4) Weighting differentials for certain securities relating to whole versus partial share accounting, 5) Timing and pricing of rebalancing actions, and other minor factors.
Conservative benchmark = total returns for 10.0% Russell 3000 Index, 65.0% Bloomberg US Aggregate Bond Index, and 10.0% MSCI World ex-US Index and 15.0% cash allocations.
Not counting its allocation to cash, five of Conservative’s 35 holdings in 3Q22 generated a positive performance contribution: the aforementioned DE, MPC, and SJNK, as well as Amazon [AMZN (+3.7%)] and CVS Health [CVS (+2.8%)]. For the YTD and Since Inception periods Energy companies Schlumberger (SLB) and Total (TTE), health insurer Cigna (CI), and defense and aerospace concern Lockheed Martin (LMT) also contributed positively to portfolio returns. Semiconductor equipment manufacturer Applied Materials [AMAT (-39.5% SI) along with Nike [NKE (-48.4% SI)] joined Communication Services companies CMCSA and PARA in presenting the stiffest headwinds for portfolio performance.
Moderate Model Portfolio
The Moderate Model Portfolio performance exceeded benchmark and S&P 500 performance for 3Q22, YTD, and SI, time periods, returning -4.5% for 3Q22, -15.8% YTD, and -12.1% SI. The Moderate portfolio allocates 45% of assets to fixed income, 3.5% to international equities, 41.5% to domestic equities, and 10% to cash. These allocations place Moderate at a significant overweight position to domestic equities vis-à-vis the benchmark’s 22.5% allocation, reflective of the view (correct thus far since inception) that U.S. equities will outperform international stocks.
| Solyco Wealth Moderate Model Portfolio Comparative Performance: 3Q22, YTD, and Since Inception | ||||
| 3Q22 | Year-to-Date | Since SW Inception | ||
| Benchmarks | S&P 500 | -5.70% | -23.87% | -19.38% |
| Russell 3000 | -5.35% | -24.62% | -21.34% | |
| MSCI All-World ex-US | -10.45% | -26.71% | -28.17% | |
| Bloomberg US Agg Bond | -4.34% | -14.50% | -15.07% | |
| Moderate Model Portfolio | Portfolio Return | -4.48% | -15.80% | -12.05% |
| Benchmark Return | -5.47% | -18.03% | -17.87% | |
| +/- Benchmark | 0.99% | 2.22% | 5.82% | |
| +/- S&P 500 | 1.22% | 8.06% | 7.33% | |
| +/- Equities vs. S&P 500 | -0.15% | 4.52% | 9.02% | |
| +/- Fixed Income vs. Agg | 0.70% | 0.29% | 0.92% | |
The above table reflects a 1% annual management fee, or 0.25% for 3Q22, 0.75% year-to-date through 9/30/2022, and 1.075% since exception.
Actual client investment performance likely will differ from respective model portfolio performance due to several factors including: 1) Timing of securities purchases and sales, 2) Dividend reinvestment choices, 3) Securities held outside the model portfolio, 4) Weighting differentials for certain securities relating to whole versus partial share accounting, 5) Timing and pricing of rebalancing actions, and other minor factors.
Moderate benchmark = total returns for 22.5% Russell 3000 Index, 45.0% Bloomberg US Aggregate Bond Index, and 22.5% MSCI World ex-US Index, and 10.0% cash allocations.
In addition to previously mentioned positive contributions from DE, MPC, and SLB, the Moderate Model Portfolio also benefited since inception from the upside performances of:
- Oil and gas firm Pioneer Natural Resources [PXD (+62.2% since inception)],
- Vertex Pharmaceuticals [VRTX (+50.6% since inception)],
- Health insurer Centene [CNC (+28.3% since inception and sold 12/10/21)],
- Medical technology company AbbVie [ABBV (+49.7% since inception and sold 3/18/22)] and,
- Broadcom [AVGO (+28.1% since inception and sold 12/14/21)].
Eastman Chemical [EMN (-34.1% SI)] and Advanced Micro Devices [AMD (-42.0% SI)] join CMCSA, PARA, and NKE, in presenting significant challenges to higher Moderate portfolio returns.
Moderately Aggressive Model Portfolio
As it has since inception, the Moderately Aggressive Model Portfolio defined Solyco Wealth’s top-performing portfolio for 3Q22 with a 3.8% loss. Through the first nine months of 2022 Moderately Aggressive lost 13.8%, which exceeded benchmark and S&P 500 performances for the same nine-month period by 6.5% and 10.1%, respectively. Moderately Aggressive performed modestly better since inception as its 8.9% loss exceeded by 10.9% the benchmark’s 19.8% loss and by 10.5% the S&P 500’s 19.4% loss.
| Solyco Wealth Moderately Aggressive Model Portfolio Comparative Performance: 3Q22, YTD, and Since Inception | ||||
| 3Q22 | Year-to-Date | Since SW Inception | ||
| Benchmarks | S&P 500 | -5.70% | -23.87% | -19.38% |
| Russell 3000 | -5.35% | -24.62% | -21.34% | |
| MSCI All-World ex-US | -10.45% | -26.71% | -28.17% | |
| Bloomberg US Agg Bond | -4.34% | -14.50% | -15.07% | |
| Moderately Aggressive Model Portfolio | Portfolio Return | -3.78% | -13.78% | -8.89% |
| Benchmark Return | -6.18% | -20.26% | -19.81% | |
| +/- Benchmark | 2.39% | 6.48% | 10.91% | |
| +/- S&P 500 | 1.92% | 10.09% | 10.49% | |
| +/- Equities vs. S&P 500 | 0.77% | 8.90% | 11.74% | |
| +/- Fixed Income vs. Agg | 0.58% | 0.92% | 2.28% | |
The above table reflects a 1% annual management fee, or 0.25% for 3Q22, 0.75% year-to-date through 9/30/2022, and 1.075% since exception.
Actual client investment performance likely will differ from respective model portfolio performance due to several factors including: 1) Timing of securities purchases and sales, 2) Dividend reinvestment choices, 3) Securities held outside the model portfolio, 4) Weighting differentials for certain securities relating to whole versus partial share accounting, 5) Timing and pricing of rebalancing actions, and other minor factors.
Moderately Aggressive benchmark = total returns for 32.5% Russell 3000 Index, 25.0% Bloomberg US Aggregate Bond Index, and 32.5% MSCI World ex-US Index, and 10.0% cash allocations.
With a 65% equity weighting, substantially skewed to better-performing US equities, stock-picking drove the Moderately Aggressive Model Portfolio’s relative out-performance. Stock performance in the portfolio exceeded that of the S&P 500 by 11.7% since inception. The fixed income exchange traded funds (ETFs) in Moderately Aggressive also contributed to its comparative upside as their performance exceeded that of the benchmark Bloomberg US Aggregate Bond Index by 228 basis points.
International holding Sociedad de Quimica y Minera (SQM), one of the world’s largest lithium producers, paced Moderately Aggressive performance as it moved 7.7% higher for the quarter, +83.2% for all of 2022, and up 78.2% since inception. Joining SQM in supporting the portfolio’s performance were PXD, SLB, VRTX, MPC and DE. In addition to the significant declines experienced with CMCSA and PARA, Moderately Aggressive also suffered downside from cloud tech firm Service Now [NOW (-42.9% SI)], search leader Alphabet [GOOGL (-33.7% SI)], and Vanguard Emerging Markets Government Bond ETF [VWOB (-24.5% SI)].
Aggressive Model Portfolio
Distinctly risk-off attitudes in 2022 decidedly hampered Aggressive Model Portfolio returns as it posted losses of 5.6% for 3Q22, 19.5% YTD, and 15.9% SI. These performances outpaced those of the benchmark by 1.8%, 4.3%, and 7.1%, respectively, and those of the S&P 500 by 0.2%, 4.3%, and 3.4%. Indicative of transitions in fixed income markets in 3Q22, which saw a more positive reception for credit exposure, the model’s fixed income positions outperformed the Bloomberg US Aggregate Bond Index by 2.3% in that period. For the YTD and SI periods equities remained responsible for Aggressive’s outperformance.
| Solyco Wealth Aggressive Model Portfolio Comparative Performance: 3Q22, YTD, and Since Inception | ||||
| 3Q22 | Year-to-Date | Since SW Inception | ||
| Benchmarks | S&P 500 | -5.70% | -23.87% | -19.38% |
| Russell 3000 | -5.35% | -24.62% | -21.34% | |
| MSCI All-World ex-US | -10.45% | -26.71% | -28.17% | |
| Bloomberg US Agg Bond | -4.34% | -14.50% | -15.07% | |
| Aggressive Model Portfolio | Portfolio Return | -5.55% | -19.53% | -15.94% |
| Benchmark Return | -7.30% | -23.80% | -23.01% | |
| +/- Benchmark | 1.75% | 4.27% | 7.07% | |
| +/- S&P 500 | 0.15% | 4.33% | 3.44% | |
| +/- Equities vs. S&P 500 | -0.86% | 3.78% | 3.36% | |
| +/- Fixed Income vs. Agg | 2.27% | -1.36% | -1.40% | |
The above table reflects a 1% annual management fee, or 0.25% for 3Q22, 0.75% year-to-date through 9/30/2022, and 1.075% since exception.
Actual client investment performance likely will differ from respective model portfolio performance due to several factors including: 1) Timing of securities purchases and sales, 2) Dividend reinvestment choices, 3) Securities held outside the model portfolio, 4) Weighting differentials for certain securities relating to whole versus partial share accounting, 5) Timing and pricing of rebalancing actions, and other minor factors.
Aggregate benchmark = total returns for 45% Russell 3000 Index, 5.0% Bloomberg US Aggregate Bond Index, 45% MSCI World ex-US Index, and 5.0% cash allocations.
Earthstone Energy [ESTE (+49.0% SI)] marked the only out-performing equity not held in the other portfolios and previously mentioned. Shopify [SHOP (-80.4% SI)] and Yeti [YETI (-70.6%)], despite continuing to post impressive absolute and relative growth amidst economic turmoil, posted substantial negative returns for the portfolio. Notably, active management, including dollar-cost averaging and covered-call writing, significantly reduced the actual magnitude of losses from these securities within the client portfolios that hold them and that follow the Aggressive Model Portfolio.
 For taxable accounts tax-loss harvesting may be the most valuable portfolio management activity in which one can engage before year-end 2022. Depending on individual situations, the depth and breadth of asset market downturns this year probably offer numerous value-adding opportunities that tax consequences prohibited in prior years such as:
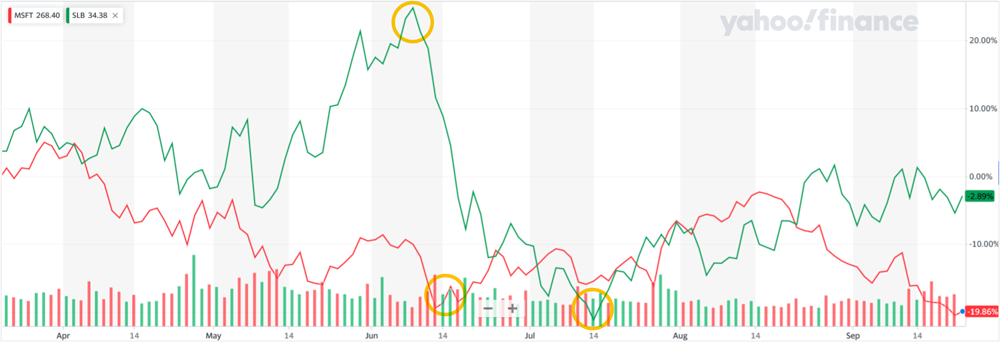
 I got into this business over 20 years ago as an institutional equity salesperson for an upstart investment bank staked by a mid-sized bank. Although I was green as a gourd, I worked with seasonal professionals that had worked on the largest trading floors in the country. Compelling clients to trade with my firm and thus, generate commissions was the name of the game. Admittedly, I proved to be not very good at it, but I understood the motivation: trade. From an individual retail investor to the most sophisticated hedge fund trader the motivation to trade ultimately remains the same – to make a buck or a few million bucks. How do the drivers of trading differ, though, and how might recognizing the motivations to trade aid us in making more bucks (or losing fewer of them)?
 The yo-yo path on which assets markets traded in 2022 finally bounced to the upside in July and early August only to traverse their downward trajectory – again – later in August and early September. Of late, Fed comments from Brainerd and Powell reinvigorated upside drivers with little more than recognition that increases in the Fed Funds Rate could push the U.S. economy into a recession. Sometimes knowing the problems half the battle…
 Few life events are as painful and undesired as dealing with the deaths of loved ones. Cleaning up the mess than many of these loved ones leave behind when they pass ranks as a close second, though. We recently spoke with a prospective client that lost multiple family members in a rather short period of time. First, in-laws died with no will and multiple properties in multiple states. Death of the spouse soon followed prior to probate closing. As it these events failed to create sufficient grief, the in-laws apparently never came across an item they did not want to keep: the propensity to hoard resulted in no less than five dumpsters of “stuff” being carried off from just one of the inherited properties. Creating positive memories after disposing of tons of unwanted “stuff” will challenge even the most gracious of us. Below, we short-list items that not only will leave your loved ones better off when you go, but also likely will aid the rest of your time with us.
 Anything but a consensus view exists with respect to the probable future direction for stocks and bonds. To be sure, the latest two-month advance in risk assets caught more than a few bears by surprise. Short-covering almost certainly added frothiness to the July-August gains, but a 50% retracement of earlier 2022 losses provides a fairly solid base for positive momentum. For the lucky few that covered their short positions in the mid-June downdraft, though, post-2Q22 earnings season may offer an opportune time to re-short their most disdained stocks. After all, as the chart below from Yardeni Research shows, September historically provides the worst month for the stock market. What’s an investor to make of this environment?
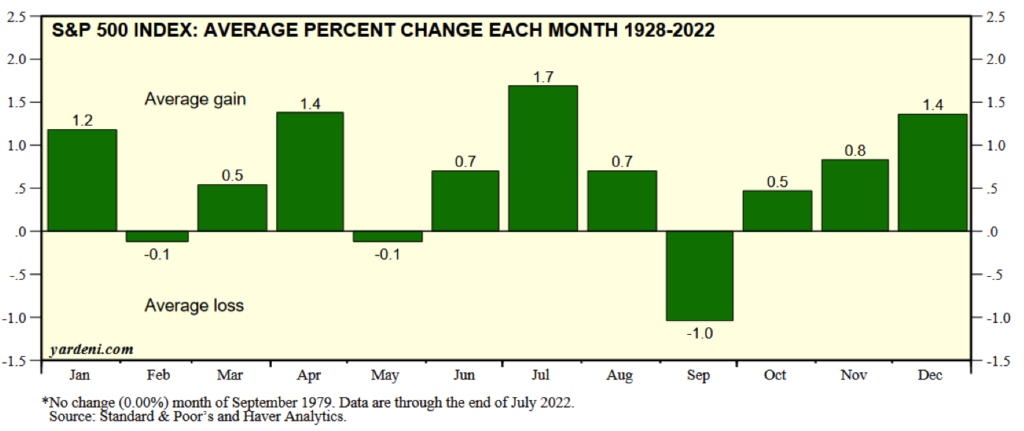
 The dog days of August offer prime time for financial planning and goal reviews. Sure, no one wants to consume vacation time with thoughts of budgets and investments and planning. The clearer heads that prevail when not consumed by work, however, provide optimal opportunities for focusing on such tasks. Maybe run through mental checklists while driving or sitting in the airport waiting for flight to board… work with me here: it will be to your benefit.
 The week of July 25th not only is the biggest week for 2nd quarter earnings news, doubly important for showing how well (or not) companies fared through the tumultuous last three months as well as for how well they expect to do for the balance of 2022, but also for U.S. GDP performance for the last quarter and the Federal Reserve Bank’s decision on the degree it will increase its discount rate. Whew! This stacks a great deal of market-moving material in a compressed time period just before many take off for beaches, mountains, etc. for a much-needed August vacation.
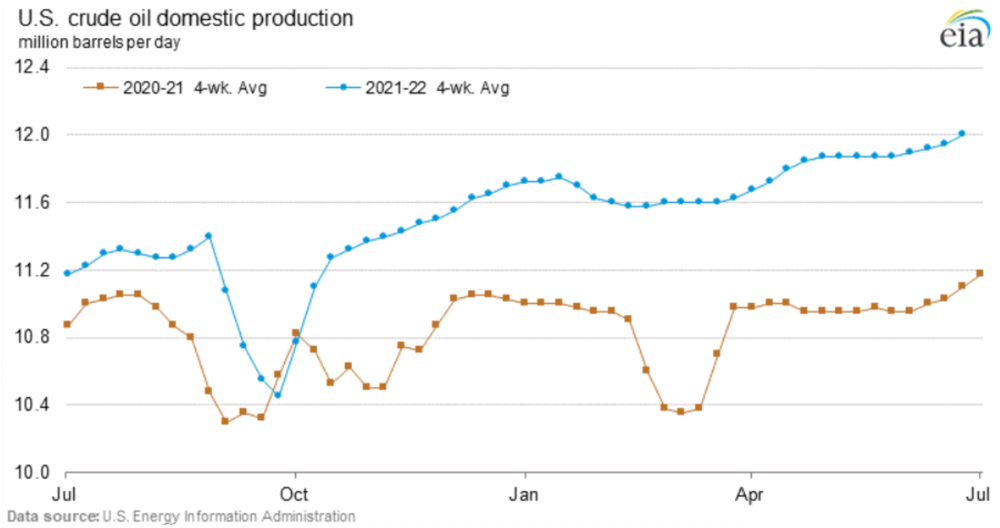
 High gasoline prices continue to plague efforts to lower inflation worldwide. The Russian invasion of Ukraine and the resulting sanctions prohibiting purchases of Russian oil substantially exacerbate tightness in world crude oil and petroleum product markets. As discussed below, markets dynamics foretold worldwide crude oil demand outpacing supply months before Putin’s ill-conceived attack. The Russia-Ukraine war and resulting market changes, however, wreaked such havoc on world markets that the US exported approximately 1.1 million barrels per day (Mmbpd) of crude oil and petroleum products on average over the past four weeks versus importing 343,000 barrels per day over the same four-week period a year ago. This ~1.5 Mmbpd swing to exports from imports represents a $20 per barrel to $30 per barrel swing in crude oil prices.
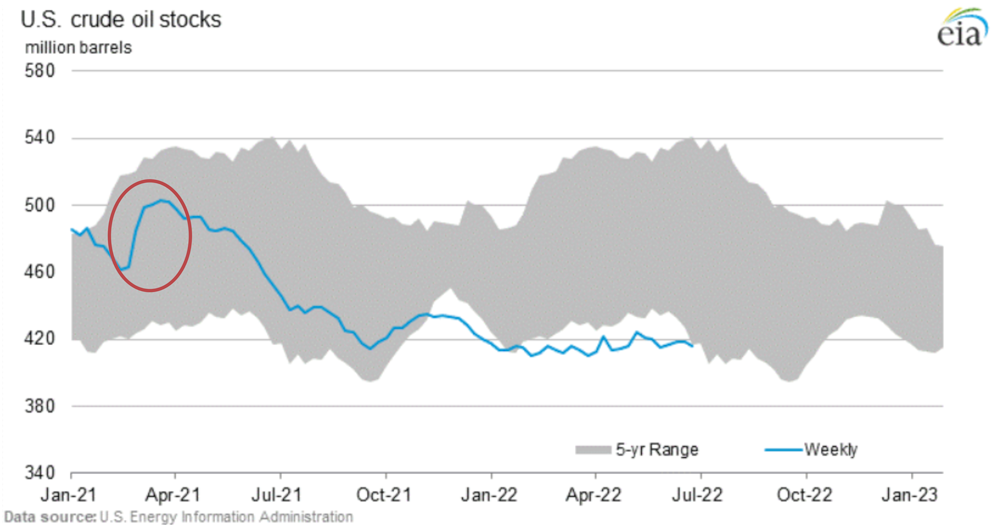


 While the 2022 downdraft for risk assets accelerated in 2Q22, the four model portfolios managed by Solyco Wealth remained, after fees, ahead of their benchmarks and the S&P 500 for seven of eight observations year-to-date (YTD) and since inception (SI). Year-to-date only the Conservative Model Portfolio, after a 0.50% fee, lagged its benchmark, doing so by 32 basis points (bps), or 0.32%. Performance after fees for all four portfolios– Conservative, Moderate, Moderately Aggressive, and Aggressive – exceeded that of the S&P 500 YTD led by the Moderately Aggressive Model Portfolio outdistancing the index by 809 bps, or 8.09%.