 As exhibited in the following data table, Solyco Wealth’s four model portfolios, which offer investors solutions across the risk spectrum, outperformed their benchmarks after fees in 1Q22 and since inception (9/8/2021). Performance for the Moderate and Moderately Aggressive models exceeded that of the S&P 500 since inception while performances for each of the for portfolios after fees exceeded that of the S&P 500 since the first of the year.
Solyco Wealth Model Portfolio Performance, After Fees, Since Inception and 1Q22
| Period Performance |
Model Portfolios |
Major Indices |
| Conservative |
Moderate |
Moderately Aggressive |
Agressive |
S&P 500 |
Bloomberg Fixed
Income ETF |
| Since Inception |
-1.35% |
1.64% |
4.97% |
0.92% |
1.03% |
-6.48% |
| vs. Benchmark |
3.67% |
6.39% |
9.23% |
4.89% |
|
| vs. S&P 500 |
-2.38% |
0.61% |
3.94% |
-0.11% |
| Year-to-Date/1Q22 |
-2.83% |
-0.20% |
1.83% |
-1.52% |
-4.84% |
-5.80% |
| vs. Benchmark |
1.98% |
4.76% |
6.68% |
3.47% |
|
| vs. S&P 500 |
2.02% |
4.65% |
6.67% |
3.32% |
| Equity Portion Since Inception |
3.57% |
8.25% |
8.97% |
2.00% |
| vs. S&P 500 |
2.54% |
7.23% |
7.94% |
0.97% |
| Fixed Income Since Inception |
-2.53% |
-3.37% |
-0.45% |
-6.45% |
| FI vs. B-berg FI ETF |
3.95% |
3.11% |
6.04% |
0.04% |
| Equity Portion YTD/1Q22 |
-3.12% |
3.49% |
3.78% |
-1.11% |
| vs. S&P 500 |
1.73% |
8.33% |
8.63% |
3.74% |
| Fixed Income YTD/1Q22 |
-2.73% |
-3.39% |
-1.28% |
-5.70% |
| FI vs. B-berg FI ETF |
3.07% |
2.40% |
4.51% |
0.10% |
Past Performance Is Not Indicative of Future Results
Solyco Wealth used Morningstar Direct to calculate the above returns for since inception and 6-mpnth period from September 8, 2021, through March 31, 2022.
The above table reflects a 1% annual management fee, or 0.56% since exception and 0.24% year-to-date through 3/31/2022.
Actual client investment performance likely will differ from respective model portfolio performance due to several factors including: 1) Timing of securities purchases and sales, 2) Dividend reinvestment choices, 3) Securities held outside the model portfolio, 4) Weighting differentials for certain securities relating to whole versus partial share accounting, 5) Timing and pricing of rebalancing actions, and other minor factors.
Conservative benchmark = total returns for 10.0% Russell 3000 Index, 65.0% Bloomberg US Aggregate Bond Index, and 10.0% MSCI World ex-US Index and 15.0% cash allocations.
Moderate benchmark = total returns for 22.5% Russell 3000 Index, 45.0% Bloomberg US Aggregate Bond Index, and 22.5% MSCI World ex-US Index, and 10.0% cash allocations.
Moderately Aggressive benchmark = total returns for 32.5% Russell 3000 Index, 25.0% Bloomberg US Aggregate Bond Index, and 32.5% MSCI World ex-US Index, and 10.0% cash allocations.
Aggregate benchmark = total returns for 45% Russell 3000 Index, 5.0% Bloomberg US Aggregate Bond Index, 45% MSCI World ex-US Index, and 5.0% cash allocations.
Relatively strong equity performances benefited Solyco Wealth’s model portfolios across all four strategies with stock picks in the Moderately Aggressive and Moderate models performing particularly well. Fixed income allocations, generally, remained challenged in both the since inception and the 1Q22 time periods.
In the Aggressive model allocations to Shopify, YETI, and Viatris hampered performance while positive contributions from Earthstone, Schlumberger, Sociedad de Quimica y Minera, and Vertex Pharma, offset those headwinds. In the Moderately Aggressive portfolio positive contributions from Schlumberger, Pioneer Natural Resources, Sociedad de Quimica y Minera, and Vertex Pharma, easily made up for the downside moves from Nike, Comcast, Autodesk, and American Tower. Similarly, the Moderate model experienced negative contributions from its holdings in Comcast, Taiwan Semi, and Blackrock, that Schlumberger, Pioneer Natural and Lockheed Martin more than made up for. Unfortunately, the 20% overall allocation to equities in the Conservative model proved insufficient to offset the fixed income headwinds presented from its longer duration and international debt allocations despite outsized upside benefits from Lockheed Martin, Schlumberger, and TotalEnergy.
Volatility probably will remain elevated as compared to 4Q21 until the Ukraine-Russia situation concludes. No guesses as to when that happens, however… Barring a significant escalation of the conflict, we anticipate asset market volatility not approaching the levels experienced in late February and early March, though. The fact that the Fed commenced their cycle of interest rate increases and that the rate of increase of consumer expenditures appeared to slow, if only modestly, late in 1Q22, lend some confidence to this expectation for reduced volatility.
For the time being remaining overweight Energy and Health Care equities appears to be a good idea. Potentially adding to Industrials stocks if inflation actually slows, supply chains loosen up, and infrastructure spending rotates up the Federal agenda presents a possibility for additional capital deployment heading into Summer 2022 as well. Increased fixed income and cash holdings appear to only be solid investing ideas if the Ukraine situation re-escalates or another crisis arises, which we decidedly hope is not the case.
As always, please give us a call if you’d like some help defining and meeting your financial and investing goals: (713) 444-3560.
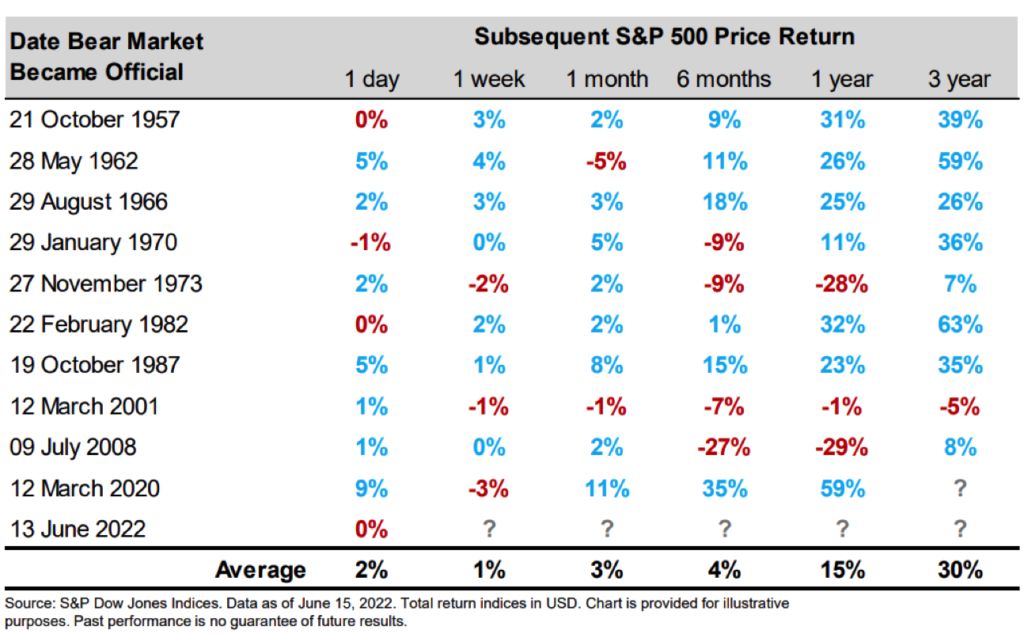
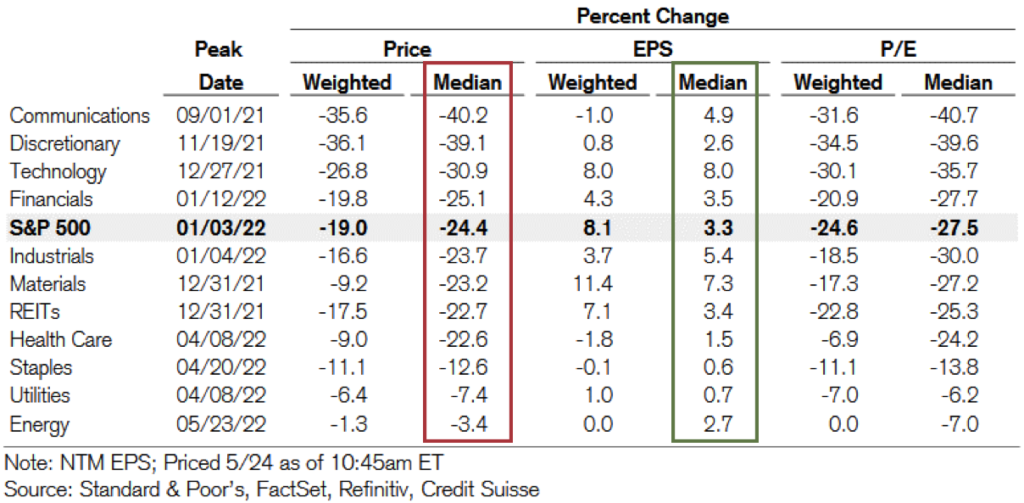
 A bear market for the benchmark S&P 500 came out of hibernation Monday (6/13) as the index breached the 20% loss level from its previous high January 3, 2022. Bear market conditions did not hibernate as long as usual this go around as only 22 months passed since the March 23, 2020, end of the prior, COVID-induced bear market, which only lasted a little longer than a month. This marked the shortest span between two bear markets since at least the Great Depression, as shown in the following table from S&P.
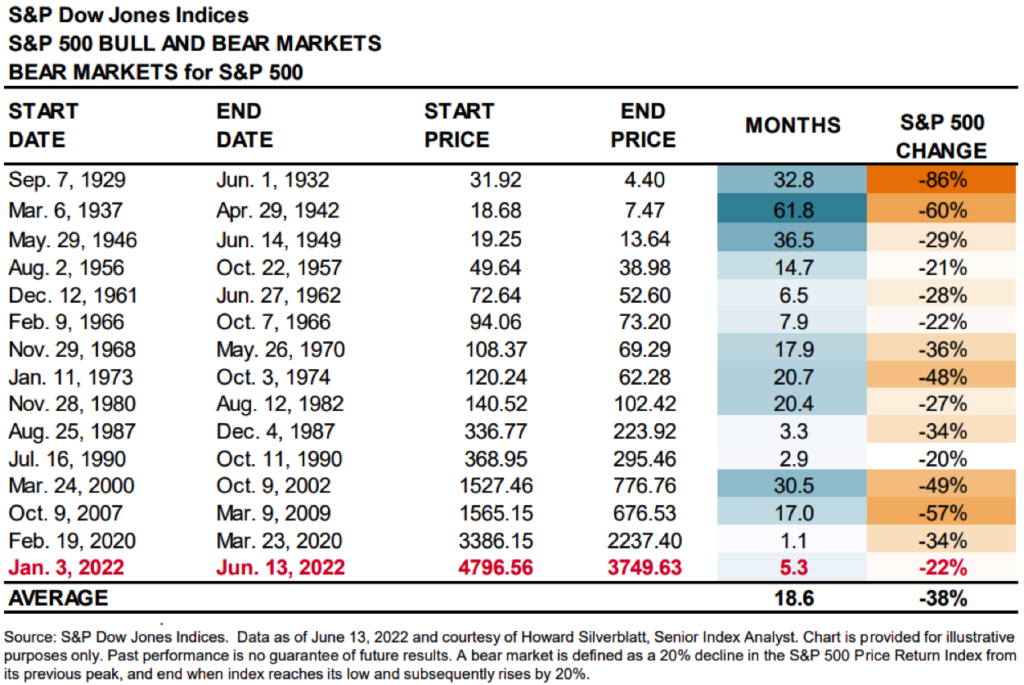
 Too much money chasing too few goods and services: inflation. Inflation is not a difficult concept to describe or to understand. Little Jill has an extra stick of gum that Jack would like to buy for a nickel. All looks good for Jack to enjoy a stick of gum until Billy, who also would like a stick of gum, arrives with a nickel and a penny he found on his walk over. Jill, ever the rational seller, agrees to sell Billy her last stick of gum for $0.06. Voilà, the Jill-Jack-Billy market for gum just experienced 20% price inflation.
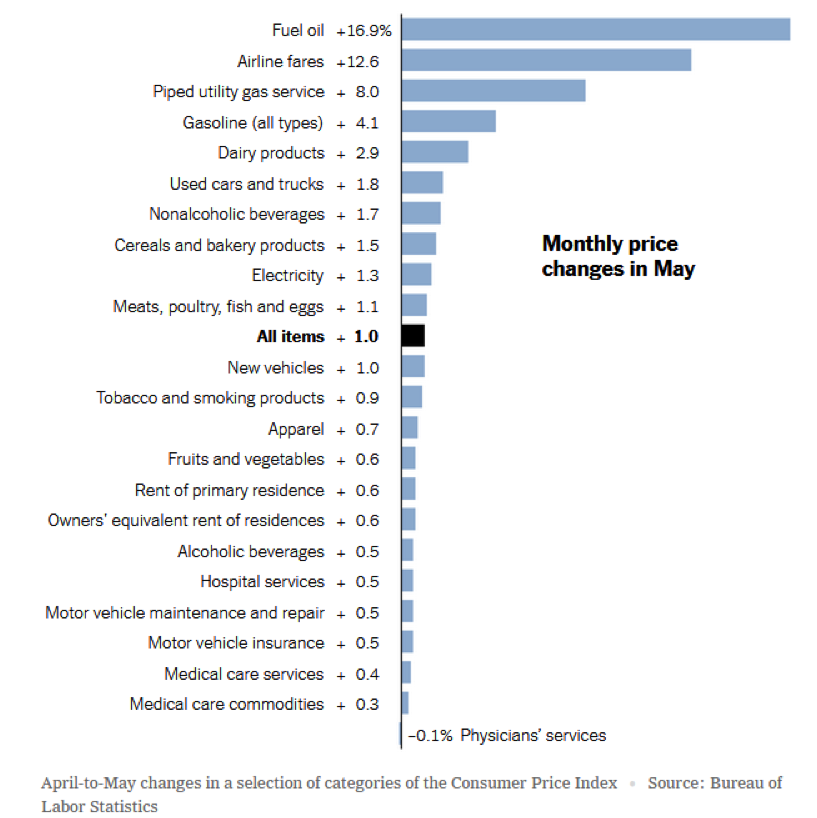
 Dollar-cost averaging provides investors a tool with which they may use volatility to their advantage. Properly employed, the process offers benefits for buyers and sellers of traded assets ranging from stocks to bonds, cryptocurrencies, sports bets, and collectibles. Trading costs, both in terms of effort and commissions, mark drawbacks to the method.
 Adages, aphorisms, sayings, and such gain popularity because they so often prove to be correct. A handful of my favorites:
 The Although temperatures in many parts of the US recently felt summer-like, several weeks of spring remain. Consumer price inflation and asset market volatilities probably make those temps feel even hotter. These phenomena may have resulted in relatively large changes in incomes, expenses, as well as the sources of these incomes and expenses. As such, for many of us the next few weeks before summer and, hopefully, vacations arrive, may prove fruitful for midyear financial plan reviews.
 The Raise your hand if your sick and tired of hearing about inflation. Yeah, me too. I raised my hand and I’m sitting in a room, by myself.
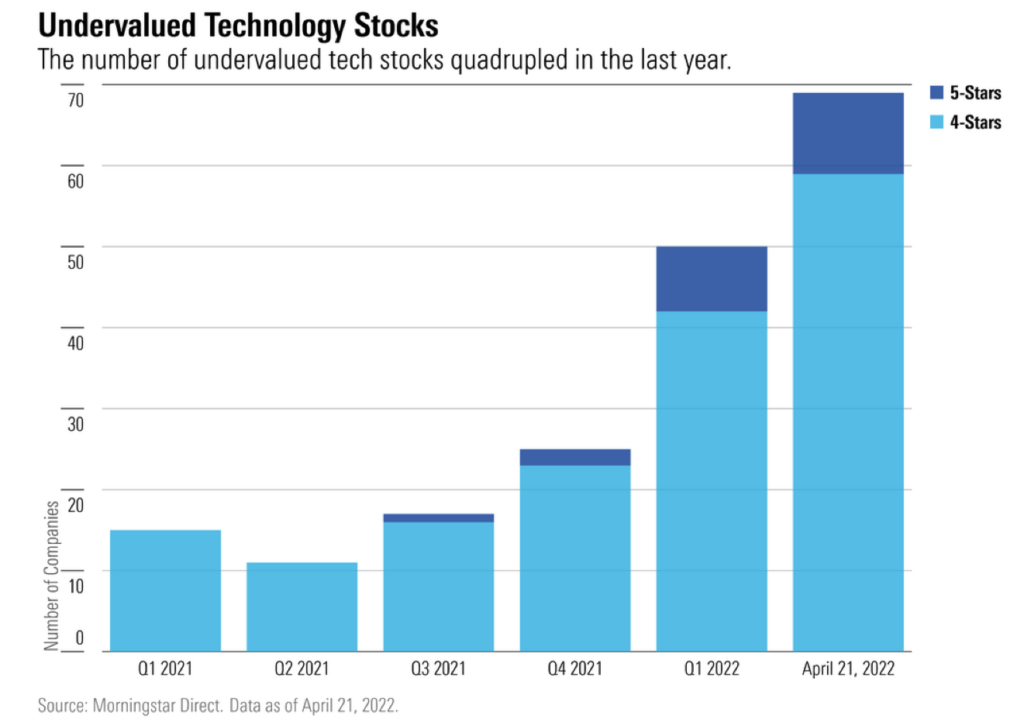
 The 2022 wreck in Tech stocks, which declined ~19.8% as measured by the price change in Vanguard’s IT Index Fund (VGT), took a short reprieve yesterday (4/25/22). More share price pummeling commenced today (4/26/22), however, as one can see in the Yahoo! Finance chart below.
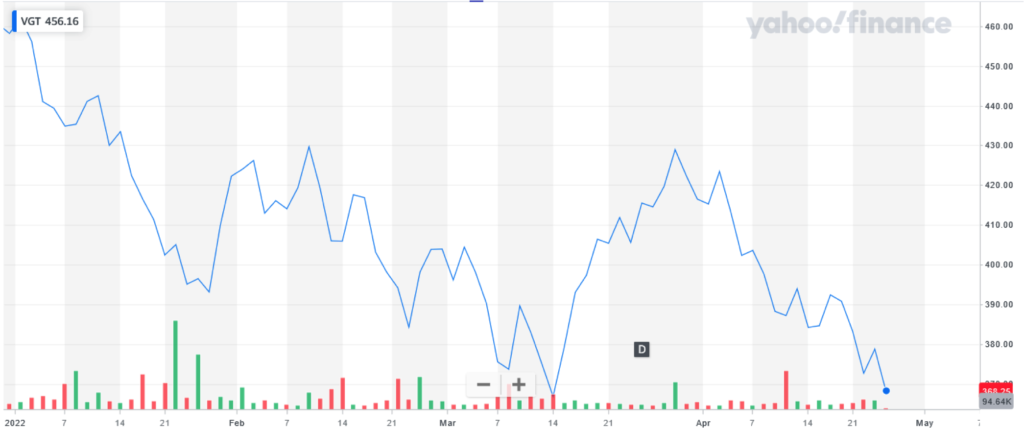
 A little while back I decided it time to go contrarian for Solyco Wealth’s Conservative Model Portfolio. I dropped its Cash allocation to 10% from 15%, added that 5% to its Equity weighting, and reallocated its long-term domestic bond exposure to floating rate senior loans. With the already low-yielding iShares 20+ Year Treasury Bond ETF (TLT) down a double-digit percentage to start the year amidst the Fed just commencing its interest rate hiking cycle in response to escalating inflation, it felt right go at least a little bit on the offensive.
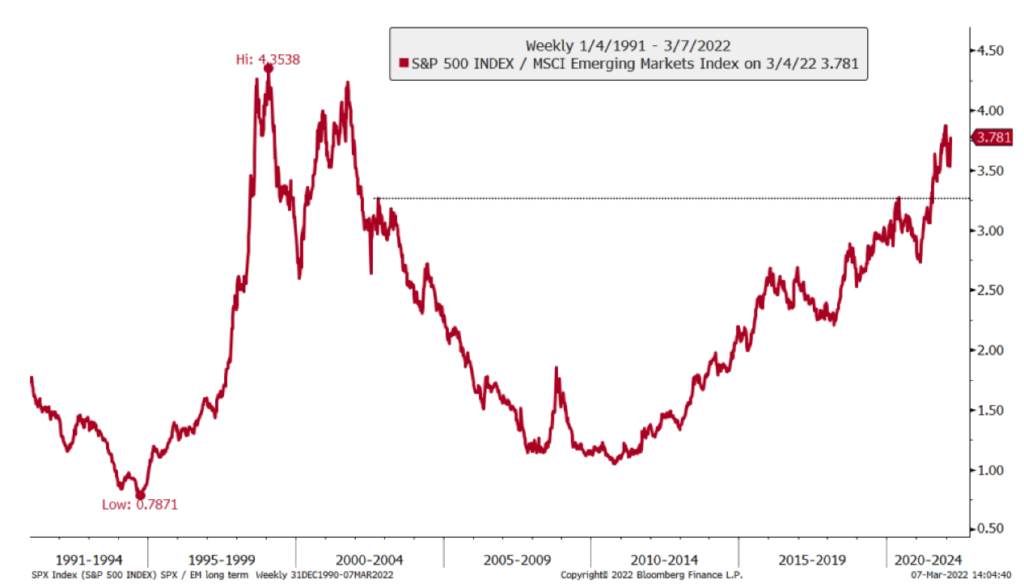
 Investing best practices continue to advocate for diversifying US markets exposures with allocations to international markets. With similar headwinds negatively impacting international markets to the same, or in many instances worse, degree as the domestic asset markets, many investors likely question the near- to medium-term value of this diversification. Doubling down on this investor skepticism for international investing: the fact that foreign markets, in general, only offered diversification by lagging US asset markets over much of the past 10 years (chart below).