Strong 1Q23 Risk-Asset Markets Benefit Solyco Wealth Model Portfolios
 A 1Q23 rebound in risk-asset markets resulted in each of Solyco Wealth’s four model portfolios posting positive returns for the past quarter. Net of fees this drove the average outperformance for the portfolios versus their respective benchmarks to 4.55% for the prior year and to 9.85% since their 9/8/21 inception, as shown in the following graphs. Alas, the particularly strong equity market performance in 1Q23 translated to modest after-fee average underperformance for the four portfolios of -0.36% versus benchmark and 2.03% vs. the S&P 500. Notably, each of the four model portfolios also retains a fixed income weighting, ranging from 65% for the Conservative Model Portfolio to 5% for the Aggressive Model Portfolio, that typically hampers performance in strong equity markets. For the quarter the portfolios’ fixed income holdings underperformed their Bloomberg US Aggregate Bond Index (AGG) benchmark by an average of 0.45% while equities in the portfolios lagged performance of the S&P 500 for 1Q23 by 0.47%.
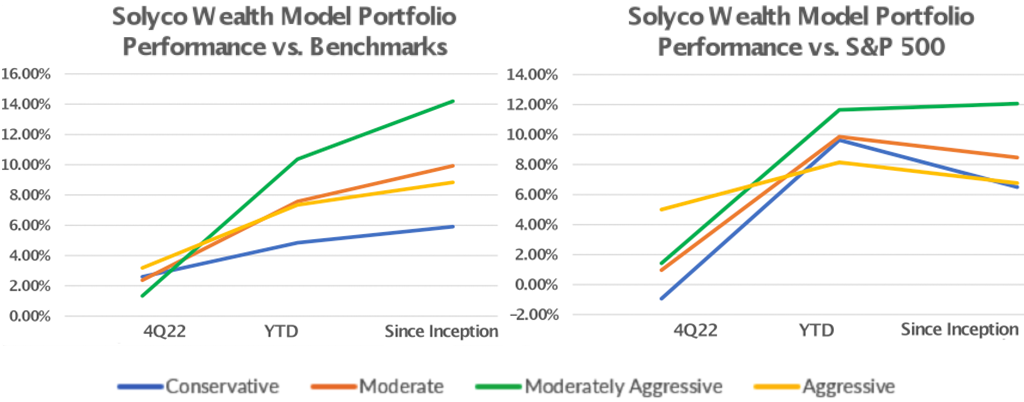
For the more extended 1-year and Since Inception time periods stock-picking across the four model portfolios remained the primary driver of outperformance as, on average and after fees, portfolio performance from equities in the portfolios exceeded that of the S&P 500 by 6.01% for the 1-year period and by 11.53% since inception. The comparable comparisons for the portfolios’ fixed income holdings versus AGG were +0.41% and +0.46%.
Conservative Model Portfolio
The Solyco Wealth Conservative Model Portfolio, after its 1% annual management fee, returned 3.52% for 1Q23, -2.07% for the 1-year period, and -3.48% since inception, as shown in the following table. These returns figures resulted in benchmark comparisons of -0.88% for the just-ended quarter, +2.80% for 1-year, and +5.31% since inception. The Conservative Model Portfolio generally holds a 65% fixed income weighting with allocations of 20% to equities and 15% to cash rounding out its holdings.
| Solyco Wealth Conservative Model Portfolio Comparative Performance: 1Q23, 1-Year, and Since Inception | ||||
| 1Q23 | 1-Year | Since SW Inception | ||
| Benchmarks | S&P 500 | 7.50% | -7.73% | -6.78% |
| Russell 3000 | 7.17% | -8.59% | -9.66% | |
| MSCI All-World ex-US | 8.02% | -2.74% | -8.92% | |
| Bloomberg US Agg Bond | 3.01% | -4.51% | -10.33% | |
| Conservate Model Portfolio | Portfolio Return | 3.52% | -2.07% | -3.48% |
| Benchmark Return | 4.49% | -4.80% | -8.77% | |
| +/- Benchmark | -0.88% | 2.80% | 5.31% | |
| +/- S&P 500 | -3.98% | 5.66% | 3.30% | |
| +/- Equities vs. S&P 500 | -1.62% | 5.10% | 10.28% | |
| +/- Fixed Income vs. Agg | -0.63% | 1.54% | 1.69% | |
The above table reflects a 1% annual management fee, equivalent to 0.25% for 1Q23 and 1.58% since the 9/8/21 inception of Solyco Wealth’s model portfolios.
Actual client investment performance likely will differ from respective model portfolio performance due to several factors including: 1) Timing of securities purchases and sales, 2) Dividend reinvestment choices, 3) Securities held outside the model portfolio, 4) Weighting differentials for certain securities relating to whole versus partial share accounting, 5) Timing and pricing of rebalancing actions, and other minor factors.
Conservative benchmark = total returns for 10.0% Russell 3000 Index, 65.0% Bloomberg US Aggregate Bond Index, and 10.0% MSCI World ex-US Index and 15.0% cash allocations.
Consistent with the primary driver of equity market positive performance in 1Q23, Technology holdings Advanced Micro Devices [(AMD) +51.3%] and Applied Materials [(AMAT) +26.4%] led the portfolio higher, followed by Amazon.com (AMZN) with a +23.0% gain for the quarter. The portfolio also realized large positive contributions from the Vanguard Tax-Exempt Bond ETF [(VTEB) +2.78% at a 10% weighting] and Vanguard Short-term Treasury ETF [(VGSH) +1.64% at a 15% weighting]. Five holdings in 1Q23 increased by over 20%, indicative of the strong tailwinds for equities last quarter.
Healthcare, which generally is considered a “defensive” sector, generated headwinds for the Conservative Model Portfolio as holdings CVS Health [CVS) -19.7%] and Johnson & Johnson [(JNJ) -11.6%] gave up ground in 1Q23. Insurer The Travelers Companies [(TRV) -8.1%] failed to help performance as well. We anticipate Healthcare improving as investment capital either rotates to it from pro-growth sectors like Technology and sub-sectors like Restaurants in response to a slowing economy or fresh equity-focused dollars enter the markets as the US economy continues to whistle past the graveyard.
Realized gains from sales over the past year of Deere & Company [(DE)+34.5%] and Marathon Petroleum [(MPC) +26.6%] joined a +24.2% 1-year contribution from ongoing holding TotalEnergies (TTE) in driving Conservative’s 1-year outperformance. Notably, VTEB at a 10% weighting in the portfolio accounted for a sizeable portion of performance as weightings to individual equities in the portfolio amount to about 1.08%. While we softened our Energy positioning mid-4Q22 due to valuation, we continue to find the municipal bond space attractive due to solid fundamentals, increasing yields, and the prospects for higher future marginal tax rates.
Horrid performances over the past year from since-sold Vanguard Emerging Markets Government Bond ETF [(VWOB) -15.9%] and still-held Hercules Capital [(HTGC) -18.8%] and iShares iBoxx High Yield Corporate Bond ETF [(LQD) -10.4%] offset the positives generated by DE, MPC and TTE. Proof of the volatility experienced over the past year, AMZN – a lead-performer in 1Q23 – actually defined the worst return in the portfolio, declining 36.6% for the year, but only at a 1.08% weighting. We continue to be AMZN fans as the company possesses significant opportunities to drive operating leverage and thus, cash flow to its bottom-line. With respect to HTGC, we believe that the company, which is a provider of private debt to high-growth Tech, Biotech, and Industrial companies, thoughtlessly fell victim to the “sell-first” mentality driven by the Silicon Valley Bank failure. In our view SVB’s demise, if anything, makes HTGC’s offerings more compelling given that it retains a very strong liquidity position with very little default risk evident to date.
Since inception Energy and Defense led performance for the Conservative portfolio with oilfield services company SLB (SLB) generating an 84.1% booked-gain, followed by TTE’s +46.5% and a 40.9% gain for fellow ongoing holding Lockheed Martin (LMT). Also of note, private capital provider Ares Capital (ARCC) posted a +7.0% move since inception at a 5% weighting. To the downside VWOB lost 25.1% for the portfolio since inception before we sold it out of the portfolio while still-held fixed income exchange traded funds (ETFs) LQD and iShares Mortgage-Backed Securities (MBB) lost 14.8% and 10.3%, respectively. We held VWOB under the incorrect assumption that the earlier moves to higher rates for many emerging market governments in combination with higher oil prices would create relative attraction for other governments’ debt versus that of the US. Russia’s assault on Ukraine and a flight to quality, however, over-whelmed our thesis. Again, AMZN, with a 41.1% loss for the portfolio since inception, represented the biggest loser, but at a much smaller weighting in the portfolio.
Moderate Model Portfolio
The Moderate Model Portfolio, which carries 45% fixed income and equity weightings against a 10% cash allocation, posted performances after fees of +4.24% for 1Q23, -2.57% for the past year through 3/31/23, and -0.77% since inception. As shown in the following table, while Moderate’s 1Q23 performance lagged that of its benchmark and the S&P 500, its long-term comparisons remain relatively attractive: +9.22% vs. benchmark and +6.01% vs. S&P 500 since inception.
| Solyco Wealth Moderate Model Portfolio Comparative Performance: 1Q23, 1-Year, and Since Inception | ||||
| 1Q23 | 2023 | Since SW Inception | ||
| Benchmarks | S&P 500 | 7.50% | -7.73% | -6.78% |
| Russell 3000 | 7.17% | -8.59% | -9.66% | |
| MSCI All-World ex-US | 8.02% | -2.74% | -8.92% | |
| Bloomberg US Agg Bond | 3.01% | -4.51% | -10.33% | |
| Moderate Model Portfolio | Portfolio Return | 4.24% | -2.57% | -0.77% |
| Benchmark Return | 5.60% | -6.30% | -9.96% | |
| +/- Benchmark | -1.31% | 3.78% | 9.22% | |
| +/- S&P 500 | -3.26% | 5.16% | 6.01% | |
| +/- Equities vs. S&P 500 | -1.50% | 5.35% | 12.57% | |
| +/- Fixed Income vs. Agg | -0.43% | 0.18% | -0.01% | |
The above table reflects a 1% annual management fee, equivalent to 0.25% for 1Q23 and 1.58% since the 9/8/21 inception of Solyco Wealth’s model portfolios.
Actual client investment performance likely will differ from respective model portfolio performance due to several factors including: 1) Timing of securities purchases and sales, 2) Dividend reinvestment choices, 3) Securities held outside the model portfolio, 4) Weighting differentials for certain securities relating to whole versus partial share accounting, 5) Timing and pricing of rebalancing actions, and other minor factors.
Moderate benchmark = total returns for 22.5% Russell 3000 Index, 45.0% Bloomberg US Aggregate Bond Index, and 22.5% MSCI World ex-US Index, and 10.0% cash allocations.
Technology holdings also propelled the Moderate Model Portfolio higher in 1Q23 as Arista Networks [(ANET) +38.3%] joined the aforementioned AMD (+51.3%) and AMAT (+26.4%) in benefiting performance. Healthcare also proved to be the primary 1Q23 challenge for Moderate performance as insurer Centene [(CNC) -22.9%] and biotech BioNTech [(BNTX) -17.1%] joined CVS (-13.6%) in creating performance headwinds.
A 10% weighting to the Vanguard Tax-Exempt Bond ETF (VTEB), which generated a +5.46% return for the portfolio, proved a prudent 4Q22 addition. It joined ANET (+20.8%), DE (+34.5%), and auto parts supplier Borg Warner [(BWA) +28.3%] as best-performing holdings for Moderate over the past year. We like BWA not only for its legacy leadership in turbochargers and engine components, but also for its growing exposure to electric vehicles (EVs). We think the technology inherent in EV components will be vastly more value-added as the sector scales than the ability to assemble those components.
To the downside for the portfolio, media and entertainment company Paramount Global [(PARA) -50.0%] joined VWOB (-15.9%), and HTGC (-18.8%) in holding back performance. We unfortunately held onto PARA thinking it was not a value trap and that the sizeable stake acquired by Warren Buffett would buoy its share price: we were wrong, obviously.
Since Inception SLB (+84.1%) and fellow energy firm Pioneer Natural Resources [(PXD) +60.8%] best performed for the Moderate portfolio, along with since-sold Vertex Pharmaceuticals [(VRTX) +63.5%]. To the downside shares of Comcast [(CMCSA) -34.7%] joined VWOB (-25.1%), PARA (-53.6%), LQD (-14.8%), and AMZN (-41.1%) in offsetting the portfolios positive contributors. Comcast, in our view, retains among the more compelling valuation profiles in the market. Alas, misplaced (in our opinion) concerns about declining broadband growth belie this strong valuation profile and propensity to return substantial excess capital – which resulted largely from past substantial broadband subscriber growth – to shareholders.
Moderately Aggressive Model Portfolio
While 1Q23 and 1-year performances for Solyco Wealth’s Aggressive Model Portfolio overtook those of its Moderately Aggressive Model Portfolio, Moderately Aggressive remained the firm’s top-performing portfolio since inception. With a +4.24% after-fee return for Moderately Aggressive since inception, outperformance versus benchmark amounted to 14.42% and versus the S&P 500 to 11.02%.
With a 65% equity weighting, performance of Moderately Aggressive’s stock picks exceeded that of the S&P 500 by 11.02% since inception and by 6.47% for the past year even after giving back 1.98% in 1Q23. The 35% fixed income allocation outperformed the AGG by 1.21% over the past 12 months and by 1.76% Since Inception with a 0.68% lag for 1Q23.
| Solyco Wealth Moderately Aggressive Model Portfolio Comparative Performance: 1Q23, 1-Year, and Since Inception | ||||
| 1Q23 | 1-Year | Since SW Inception | ||
| Benchmarks | S&P 500 | 7.50% | -7.73% | -6.78% |
| Russell 3000 | 7.17% | -8.59% | -9.66% | |
| MSCI All-World ex-US | 8.02% | -2.74% | -8.92% | |
| Bloomberg US Agg Bond | 3.01% | -4.51% | -10.33% | |
| Moderate Model Portfolio | Portfolio Return | 5.52% | -1.26% | 4.24% |
| Benchmark Return | 6.22% | -6.81% | -10.16% | |
| +/- Benchmark | -0.67% | 5.57% | 14.42% | |
| +/- S&P 500 | -1.98% | 6.47% | 11.02% | |
| +/- Equities vs. S&P 500 | -0.55% | 6.38% | 14.54% | |
| +/- Fixed Income vs. Agg | -0.68% | 1.21% | 1.76% | |
The above table reflects a 1% annual management fee, equivalent to 0.25% for 1Q23 and 1.58% since the 9/8/21 inception of Solyco Wealth’s model portfolios.
Actual client investment performance likely will differ from respective model portfolio performance due to several factors including: 1) Timing of securities purchases and sales, 2) Dividend reinvestment choices, 3) Securities held outside the model portfolio, 4) Weighting differentials for certain securities relating to whole versus partial share accounting, 5) Timing and pricing of rebalancing actions, and other minor factors.
Moderately Aggressive benchmark = total returns for 32.5% Russell 3000 Index, 25.0% Bloomberg US Aggregate Bond Index, and 32.5% MSCI World ex-US Index, and 10.0% cash allocations.
Best-performing positions for 1Q23 for Moderately Aggressive: AMD (+51.3%), Salesforce [(CRM) +50.7%], and AMAT (+26.4%). The worst-performers: CNC (-22.9%), banker Citizens Financial Group [(CFG) -22.1%], and BNTX (-17.1%). Six stock holdings in Moderately Aggressive appreciated more than 20% in 1Q23. We retain CFG ownership as our assessment of its ability to retain deposits in the wake of the banking crisis remains positive. Cracks in commercial real estate lending, however, would create problems not just for CFG, but for the vast majority of major-market and regional banks.
For the 12-month period DE (+34.5%), BWA (+28.3%), and CRM (+14.9%) drove upside performance. Headwinds primarily related to negative returns from PARA (-50.0%), AMZN (-36.6%), and CFG (-30.2%).
Lithium producer Sociedad Quimica y Minera de Chile [(SQM) +66.5%] joins already-mentioned energy firms SLB (+84.1%) and PXD (+60.8%) in generating positive results Since Inception for Moderately Aggressive. Similar to the downside drivers mentioned above for the Moderate portfolio, PARA (-50.0%), VWOB (-25.1%), AMZN (-36.6%), and CMCSA (-34.8%) also limited Moderately Aggressive’s since-inception results. Of note, however, the portfolio retained greater than 20% upside contributions from nine of its holdings for the period.
Aggressive Model Portfolio
The combination of greater equity exposure and relatively strong stock-picking enabled performance for the Aggressive Model Portfolio to overtake that of its sister Moderately Aggressive Model Portfolio for the 1-year and Since Inception periods. With a +8.62% 1Q23 return after fees, Aggressive posted a just-negative 0.61% return for the past 12 months and a just-positive 1.18% return since inception. These figures exceeded those of Aggressive’s benchmark by 1.43% for 1Q23, 6.03% for one year, and 10.43% since inception. Aggressive sports a 90% equity allocation with a 5% fixed income exposure and a 5% cash allocation.
| Solyco Wealth Aggressive Model Portfolio Comparative Performance: 1Q23, 1-Year, and Since Inception | ||||
| 1Q23 | 1-Year | Since SW Inception | ||
| Benchmarks | S&P 500 | 7.50% | -7.73% | -6.78% |
| Russell 3000 | 7.17% | -8.59% | -9.66% | |
| MSCI All-World ex-US | 8.02% | -2.74% | -8.92% | |
| Bloomberg US Agg Bond | 3.01% | -4.51% | -10.33% | |
| Moderate Model Portfolio | Portfolio Return | 8.62% | -0.61% | 1.18% |
| Benchmark Return | 7.21% | -6.64% | -9.25% | |
| +/- Benchmark | 1.43% | 6.03% | 10.43% | |
| +/- S&P 500 | 1.12% | 7.12% | 7.96% | |
| +/- Equities vs. S&P 500 | 1.79% | 7.21% | 8.71% | |
| +/- Fixed Income vs. Agg | -0.06% | -1.29% | -1.60% | |
The above table reflects a 1% annual management fee, equivalent to 0.25% for 1Q23 and 1.58% since the 9/8/21 inception of Solyco Wealth’s model portfolios.
Actual client investment performance likely will differ from respective model portfolio performance due to several factors including: 1) Timing of securities purchases and sales, 2) Dividend reinvestment choices, 3) Securities held outside the model portfolio, 4) Weighting differentials for certain securities relating to whole versus partial share accounting, 5) Timing and pricing of rebalancing actions, and other minor factors.
Aggregate benchmark = total returns for 45% Russell 3000 Index, 5.0% Bloomberg US Aggregate Bond Index, 45% MSCI World ex-US Index, and 5.0% cash allocations.
A +45.8% from South American e-commerce firm MercadoLibre (MELI) joined upside contributions from AMD (+51.3%) and CRM (+50.7%) to Aggressive’s benefit in 1Q23. These and other positive returns more than offset the losses accrued by CFG (-22.1%), CVS (-19.7%), and BNTX (-17.1%), for the last quarter. Seven equity holdings posted 20% or greater returns in 1Q23.
MercadoLibre [(MELI) +45.8%] also won the year for aggressive, followed by DE’s +38.0% contribution and a 32.6% gain for Performance Food Group (PFGC). If PARA (-33.5%), CFG (-30.2%), and YETI (-33.3%) would have performed just a little better, Aggressive might have posted a positive return for the 12-month period too!
Sociedad Quimica y Minera de Chile (SQM) at +66.5%, SLB at +84.1%, and VRTX at +63.5%, paced Aggressive’s performance Since Inception. Unfortunately, YETI (–58.8%), Shopify [(SHOP) -60.8%] and CMCSA (-34.7%) substantially pulled down Since-Inception performance for the portfolio.
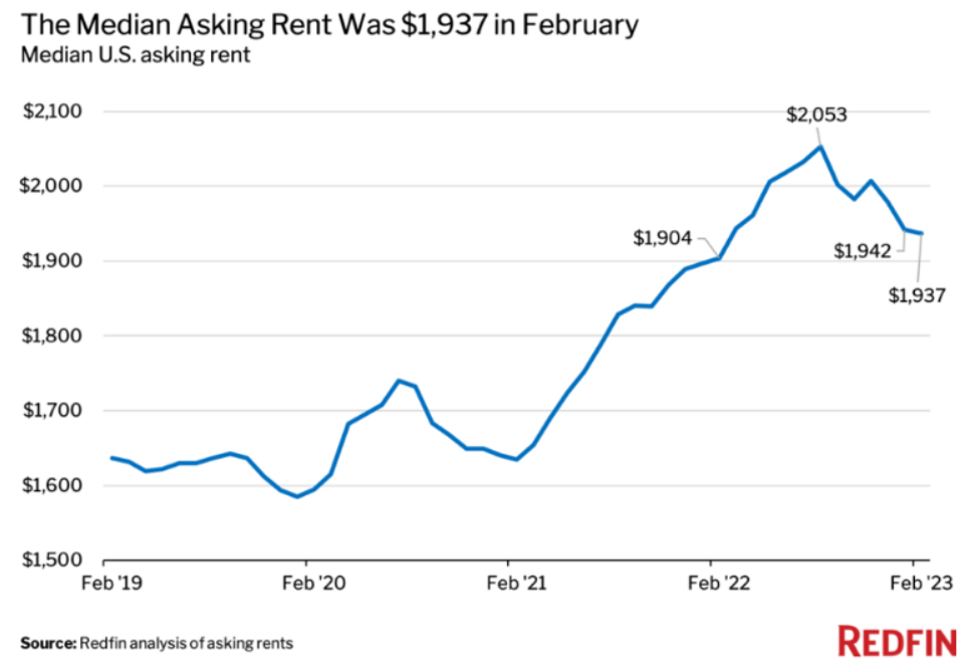
 We at Solyco Wealth anticipate the U.S. entering the most forecasted and discussed recession in economic history some time in 3Q23. One need do little more than scan Bloomberg, CNBC, or any other financial press headlines to discover the all-too-numerous drivers of this impending economic downturn. In short, recessionary drivers encompass various degrees of impacts from the U.S. Federal Reserve escalating the prevailing interest rate environment to counteract inflationary forces that resulted from aggressive acceleration of demand for goods and services, the satisfaction of which labor, logistics, and policy issues complicated, as the country and the world recovered from the worst of the COVID-19 pandemic. Oh yeah, and there was an energy price-spike brought on by Russia invading Ukraine right as that inflation component really started to take root and accelerate. Uhm, I’m forgetting something else, too, that consumers and, thus, economies dislike…bank failures! Thankfully, no one expects anything from the U.S. Congress for another couple months until the Debt Showdown: the fun just never stops!
 Covered call options and cash-secured put options represent key components of valuation and volatility management at Solyco Wealth. We remained very active in the options markets in response to the heightened volatility in equity markets that characterized the close of 2022 and the beginning of 2023. Substantial moves higher and lower for well-held stocks such as NVIDIA, Amazon, Netflix, Tesla, and Meta, among many others provide motivation for having a well thought out strategy to roll contracts prior to engaging in an initial options trade.
 The April 15, 2023, deadline for filing 2022 taxes or extensions fast approaches. Rather than commencing the filing of your taxes haphazardly, searching for statements and information on an as-needed basis, Solyco Wealth highly recommends that you spend some front-end time devising or downloading a Tax Preparation Checklist. Doing so likely will not only save time, but also reduce the probability of you or your preparer committing errors.
  Reinvesting dividends paid on shares of common stock frequently represents an outstanding way in which to benefit from the long-term compounding effect of common stock ownership. Investing website The Motley Fool calculated that the value of $10,000 invested in the S&P 500 in 1960 – with dividends reinvested through 2021– would have compounded to a cool $4.95 million. The value of the reinvested dividends accounted for $4.16 million, or 84%, of the gain, while simple share price appreciation made up only $795,800 of the increase.
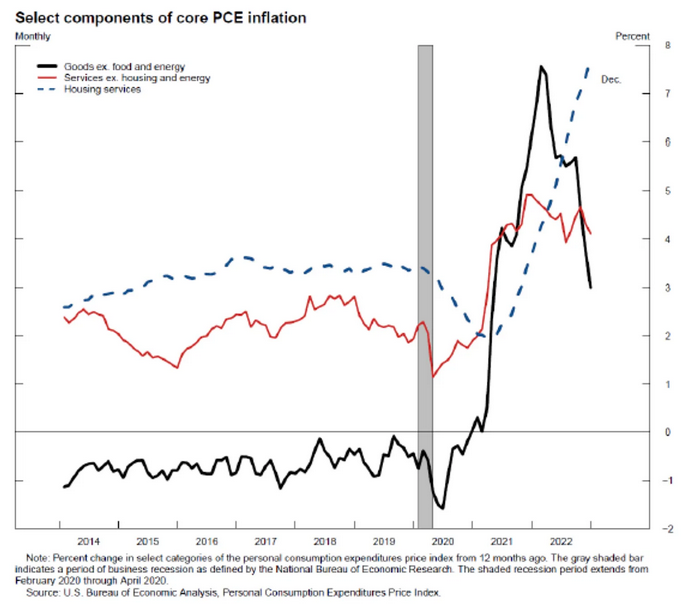
  The investment climate in 2023 likely will reflect a tale of two halves. Through the first two quarters of the year, we anticipate ongoing discussions of inflation, Fed interest rate policy, and stalling economies to dominate the investing landscape, much as they did throughout last year. The second half of 2023, however, we envision that abating inflationary pressures will lead to fading concerns for higher interest rates and more constructive thoughts of economic recovery and growth.
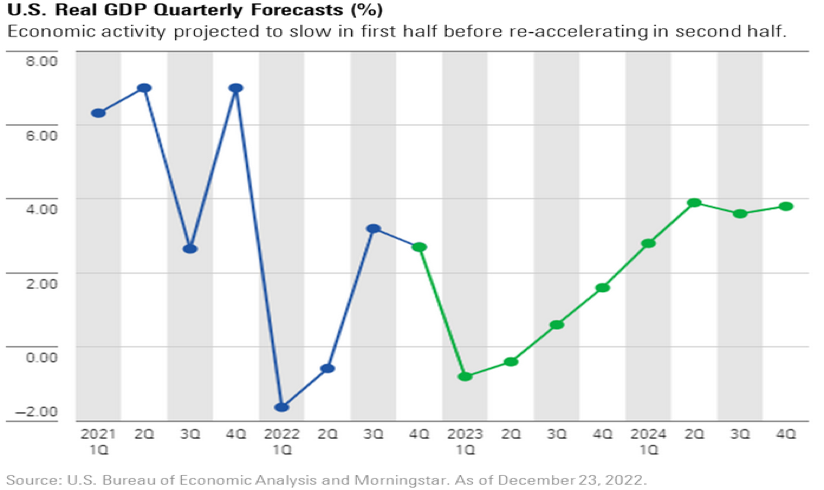
 The four model portfolios managed by Solyco Wealth generated relatively very strong performances for 4Q22, full-year 2022, and since their September 8, 2021, inception, as shown in the charts below. Except the performance of the Conservative Model Portfolio in 4Q22 vs. the S&P 500, each of the portfolios’ performances exceeded that of its benchmark as well as that of the S&P 500 and Bloomberg US Aggregate Bond Index. Since inception the Conservative, Moderate, Moderately Aggressive and Aggressive Model Portfolios averaged 9.72% of out-performance versus their respective benchmarks and 8.45% out-performance versus the S&P 500.
 With significant price swings highly characteristic of equity markets in 2022, Solyco Wealth used cash-secured puts from the options markets to manage client portfolio volatility. We anticipate many opportunities to do so in 2023 likely will arise as well as volatility appears set to persist for the foreseeable future.
 After equity markets made major moves last week and in response to the results of 3Q22 earnings season, Solyco Wealth made several key changes to its four model portfolios. Notably, we:
 Outperformance largely continued for the four model portfolios managed by Solyco Wealth in 3Q22, year-to-date in 2022 (YTD), and since inception (SI), as shown in the two graphs below. Unfortunately, with the head-fake of a recovery in risk-asset prices of July-August 2022 firmly in the rear-view mirror and the resumption of 1H22’s downward trajectory for assets prices, this outperformance translated to the four portfolios posting less negative total returns than their benchmarks and the major indices.