Value Tilt Damages 2Q24 Solyco Wealth Model Portfolio Performance
 Our lack of confidence entering 2024 in the Tech stock rally and a resulting aggressive tilt toward value stocks substantially impaired the performances of Solyco Wealth’s model portfolios in 2Q24. As relayed in the following table, each of our model portfolios posted a negative return last quarter, including our annualized 1% management fee. Poor stock-picking, which frequently saw winning picks sold too early in exchange for under-performing replacements, generally provided stiff tailwinds in the 2nd quarter as well as the first six months of the year.

Remaining disciplined with respect to valuation and diversification in a momentum-driven market did us no favors last quarter or earlier in 2024. As was the case in 4Q23, upward revisions to earnings estimates following 1Q24 earnings failed to keep pace with the acceleration in stock prices for the first six months of the year. As the business press repeatedly highlighted as well, stocks outside the Tech sector largely failed to participate in the S&P 500’s 15.2% move higher in 1H24. International equities left much to be desired from a performance standpoint as well. Leading participants in the Artificial Intelligence build-out – many of which we previously held in our portfolios – may ultimately warrant their monumental price appreciation and lofty earnings multiples. However, we remain of the opinion that AI’s deployment ultimately must lead to significant and substantial productivity gains for the balance of the economy for these gains to remain sustainable. Our model portfolios remain strongly positioned to participate in a 2H24 broadening of earnings growth to sectors beyond Technology as well as the benefits of declining interest rates. The following graph from private equity behemoth Apollo shows just how concentrated 2024 gains have been for the S&P 500 and, as a result, how few stocks have been rewarded for earnings growth.

Supporting our thesis for broadening upside participation for non-Tech and non-AI equities is the forecasted 15.2% median 2024 earnings growth anticipated for our model portfolios stocks and a 42.9% average expected 2024 earnings growth rate. Estimates of 2025 earnings growth for these same point to an additional 11.1% median and 14.6% average rate of earnings growth. All of these earnings forecasts utilize Morningstar consensus estimates.
The exchange of 2Q24 high-flier First Solar (FSLR), a leading provider of solar panels, for NICE (NICE), an Israeli-based provider of customer relationship management software, encapsulates much of our 2024 experience. We sold FSLR out of our Aggressive Model Portfolio for a fine 64% gain in the quarter only to see it appreciate 30%+ from our sale-point over the ensuing few weeks. Meanwhile NICE shares declined 20% on what appeared to be an investor’s divestment of Israeli stocks but no fundamental news.


The table below details Solyco Wealth Model Portfolios’ relative performances to that of their respective benchmarks. In our write-ups for each of the model portfolios, we detail the composition of these benchmarks while relaying details on the primary drivers of downside and upside performances for each portfolio. Our models, by rule, contain a maximum of 32 total holdings, generally composed of between 24 and 28 individual equities and three to six fixed-income exchange traded funds (ETFs). This limited number of holdings, representative of our level of conviction in our investment opinions, necessarily results periodically in substantial volatility and deviation for returns vis-à-vis those of major indices, like the S&P 500. In 2024 these expected swings in volatility and returns worked decidedly against us, but not as much as they favored our portfolios and investors in 2022 and 2023. As the adage goes, “Most money is made not by timing the markets but rather by time in the markets.”

Aggressive Model Portfolio
The Solyco Wealth Aggressive Model Portfolio, of which we allocate 80% to equity 17% to Fixed Income Exchange Traded Funds (ETFs), and 3% to Cash, declined 2.6% in 2Q24 while moving 2.5% higher in 1H24. Aggressive’s 2Q24 performance lagged that of the S&P 500 by 680 basis points (6.8%) and its benchmark by 461 basis points. The equity allocation for Aggressive lagged the S&P 500 by 7.62%, or 762 basis points (bps), while the model’s 17% debt allocation trailed the Bloomberg US Aggregate Bond Index by 0.46%. Since its September 8, 2021 inception, however, Aggressive’s 22.3% total return, including fees, outpaced that of its benchmark by 742 bps while trailing the S&P 500, which carries a 100% allocation to equities, by 366 bps.

The above table reflects a 1% annual management fee, equivalent to 0.25% for 2Q24 and 2.85% since the 9/8/21 inception of Solyco Wealth’s model portfolios.
Actual client investment performance likely will differ from respective model portfolio performance due to several factors including: 1) Timing of securities purchases and sales, 2) Dividend reinvestment choices, 3) Securities held outside the model portfolio, 4) Weighting differentials for certain securities relating to whole versus partial share accounting, 5) Timing and pricing of rebalancing actions, and other minor factors.
Aggregate benchmark = total returns for 45% Russell 3000 Index, 5.0% Bloomberg US Aggregate Bond Index, 45% MSCI World ex-US Index, and 5.0% cash allocations.
An accelerated move for DLocal (DLO), a digital payment services provider to Latin American and African merchants and consumers, most negatively impacted 2Q24 performance for the Aggressive Model Portfolio. Disappointing 1Q24 earnings for DLO saw the stock drop ~30% the day it released earnings and 45% overall for the quarter. We dollar-cost averaged into full weightings in DLO for our clients on this out-sized weakness, however, as we estimate this recently $8/share stock could be worth $30 per share on a reacceleration of earnings growth. Similarly, US healthcare behemoth CVS (CVS) saw its stock caught in a downdraft after Medicare surprisingly left its 2024 reimbursement rates unchanged from the prior year, leading management to downwardly revise anticipated future earnings. Chart Industries (GTLS), a provider of equipment for the liquefaction of natural gas (LNG) and flows of other industrial gases, which we carry at a double-weight 5.3% position in the Aggressive Model Portfolio, moved 12.4% lower last quarter. A Biden Administration decision to stay approvals of any future LNG terminals initially sent GTLS shares lower and they have yet to recover despite a consensus call for 1,000% earnings growth for ’24 over ’23.
Previously mentioned FSLR was the leading gainer for Aggressive in 2Q24, posting a +64% contribution. We sold it based on valuation discipline. Notably, while it moved 30% higher from our sale-point the stock also subsequently experienced the downside of the roller-coaster ride as it dropped 27% following the Trump-Biden Presidential Debate. Globus Medical (GMED), a provider of spinal and orthopedic surgical components, that moved up 28.4% in 2Q24 represented the 2nd largest source of price appreciation for Aggressive in 2Q24. We chose to sell it in the quarter as well, also due to valuation discipline. Tech company Palo Alto Networks, an integrated cybersecurity services provider, appreciated through our $310 target price as it added 19.3% for the quarter.
Looking to 2H24 we harbor the most positive expectations for price appreciation from Aggressive holdings in GTLS, Yum China (YUMC), DLO, and BioNTech (BNTX), which possesses several in-process clinical trials for which it expects results before year-end 2024. A turn in oil prices and our sentiment for the Energy sector would have positive implications for Aggressive as well as it retains 2.7% positions in oil and natural gas producer APA (APA) and oilfield services concern Halliburton (HAL).
Moderately Aggressive Model Portfolio
The Moderately Aggressive Model Portfolio posted a negative 2.45% return net of our annualized 1% management fee in 2Q24, trailing its benchmark by 474 bps. Poor equity performance created the most headwinds for ModAgg as its equity performance trailed that of the S&P 500 by 8.12%, or 812 basis points. Since inception, however, ModAgg remains well ahead of its benchmark – 830 bps – while trailing the 26.0% return of the S&P 500 by only 673 bps despite the fact that it retains only a 65% equity weighting.

The above table reflects a 1% annual management fee, equivalent to 0.25% for 2Q24 and 2.85% since the 9/8/21 inception of Solyco Wealth’s model portfolios.
Actual client investment performance likely will differ from respective model portfolio performance due to several factors including: 1) Timing of securities purchases and sales, 2) Dividend reinvestment choices, 3) Securities held outside the model portfolio, 4) Weighting differentials for certain securities relating to whole versus partial share accounting, 5) Timing and pricing of rebalancing actions, and other minor factors.
Moderately Aggressive benchmark = total returns for 32.5% Russell 3000 Index, 25.0% Bloomberg US Aggregate Bond Index, and 32.5% MSCI World ex-US Index, and 10.0% cash allocations.
Technology stocks led our Moderately Aggressive Model Portfolio in 2Q24, accounting for four of the model’s top five performing holdings:
- Palo Alto Network (PANW): +19.3%
- Corning (GLW): +18.5%
- Adobe (ADBE): +14.5%
- TE Connectivity (TEL): +4.0%
Biotech Incyte (INCY) posted 4th-best performance for the model in 2Q24 as it moved up 6.4%.
The biggest drag on ModAgg’s 2Q24 performance stemmed from the portfolio’s 2.3% weighting to Nike (NKE), which posted a woeful 19.5% drop last quarter on poor sales and lack of insight into any sort of near-term recovery for those sales. Medical device leader Zimmer Biomet (ZBH) declined 17.6% last quarter despite what we view as a relatively attractive environment for the elective orthopedic procedures from which the company primarily benefits. Also posting double-digit declines for ModAgg in 2Q24: oil company APA, PayPal (PYPL), BNTX, GTLS, HAL, and Kraft Heinz (KHC).
Moderate Model Portfolio
Our Moderate Model Portfolio also posted a negative 2Q24 total, after-fee return as it dropped 1.93%, under-performing its benchmark by 394 bps and the S&P 500 by 618 bps last quarter. Weak contributions from Moderate’s equity holdings, which lagged the S&P 500 by 886 bps, 1,431 bps, and 1,519 bps, over the past 3-, 6-, and 12-month periods, respectively, substantially handicapped relatively positive comparisons for its 45% fixed income weighting versus the Bloomberg Aggregate Bond Index, shown in the bottom line of the following table. Since inception Moderate’s after-fee, total 9.5% return remains 2.0% ahead of its benchmark, however.

The above table reflects a 1% annual management fee, equivalent to 0.25% for 2Q24 and 2.85% since the 9/8/21 inception of Solyco Wealth’s model portfolios.
Actual client investment performance likely will differ from respective model portfolio performance due to several factors including: 1) Timing of securities purchases and sales, 2) Dividend reinvestment choices, 3) Securities held outside the model portfolio, 4) Weighting differentials for certain securities relating to whole versus partial share accounting, 5) Timing and pricing of rebalancing actions, and other minor factors.
Moderate benchmark = total returns for 22.5% Russell 3000 Index, 45.0% Bloomberg US Aggregate Bond Index, and 22.5% MSCI World ex-US Index, and 10.0% cash allocations.
Joining the aforementioned upside contributions from PANW, GLW, and ADBE, noted in our ModAgg commentary, Moderate, by virtue of 10% weightings to each, benefited from modest price moves higher for fixed income holdings in Vanguard Short-Term Corporate (VCSH) and Vanguard Short-Term Treasury (VGSH) ETFs. Citigroup (C), which we added at a 1.55% weighting early in 2Q24, also added a +3.9% contribution to the model in 2Q24.
Albeit at slightly lower weightings, Moderate experienced negative returns from the many of the same equities that plagued Aggressive’s and ModAgg’s 2Q24 performances: CVS, NKE, APA, PYPL, BNTX, and HAL. Indicative of the negative impact imposed on longer duration fixed income securities from the lack of Fed rate cuts thus far in 2024, Moderate’s 12.5% weighting in the iShares 20+ Year Treasury Bond ETF (TLT) dropped 1.98% last quarter.
Conservative Model Portfolio
After assessing our 25 bps management fee for 2Q24, our Conservative Model Portfolio posted a -1.0% return for 2Q24, pulling year-to-date (YTD) performance down to +1.4% and performance over the past 12 months lower to +6.7%. Overall since its 9/8/21 inception, Conservative is up 6.22%, after fees, 422 bps ahead of its benchmark. This medium-term out-performance primarily stems from substantially better fixed income performance than that of the benchmark Bloomberg US Aggregate Bond Index (+510 bps).

The above table reflects a 1% annual management fee, equivalent to 0.25% for 2Q24 and 2.85% since the 9/8/21 inception of Solyco Wealth’s model portfolios.
Actual client investment performance likely will differ from respective model portfolio performance due to several factors including: 1) Timing of securities purchases and sales, 2) Dividend reinvestment choices, 3) Securities held outside the model portfolio, 4) Weighting differentials for certain securities relating to whole versus partial share accounting, 5) Timing and pricing of rebalancing actions, and other minor factors.
Conservative benchmark = total returns for 10.0% Russell 3000 Index, 65.0% Bloomberg US Aggregate Bond Index, and 10.0% MSCI World ex-US Index and 15.0% cash allocations.
Palo Alto Networks, Corning, and Adobe, holdings also benefited Conservative Model Performance in 2Q24, with VCSH and VGSH also benefiting results as we allocated 15% of assets to each of these debt ETFs. Citigroup, defense concern Lockheed Martin (LMT), search leader Alphabet (GOOGL), Louisiana-based utility Entergy (ETR), and Chinese tech giant Alibaba (BABA), rounded out Conservatives positive contributors last quarter.
CVS, the long-term Treasury ETF TLT, NKE, APA, and PYPL, most negatively impacted returns for our Conservative Model Portfolio. Leather goods and clothing company Tapestry (TPR), which had its proposed combination with clothing and handbag concern Capri Holdings (CPRI) placed under review by the Federal Trade Commission, also moved 9.2% lower last quarter, hampering Conservatives returns in 2024.
 As shown in the following table, the strong start for equity markets for 2024 significantly benefited Solyco Wealth’s four model portfolios and the investors which participate in them. Broadening of the stocks driving upside in March 2024 particularly aided performance as we substantially dialed back our portfolios’ growth exposure late in 2023, favoring an aggressive value tilt. Notably, each of Solyco Wealth’s four model portfolios retain significant cash and fixed income allocations that range from a combined 20% for our Aggressive Model Portfolio to 70% on a combined basis for our Conservative Model Portfolio. Individual stock holdings in 28 to 32 companies, balanced across the 11 S&P sectors, compose all of the equity exposures for our portfolios. Notably, we employ Morningstar Direct to generate all of the returns mentioned for our model portfolios and these figures each represent returns net of our 1% annual investment management fee.


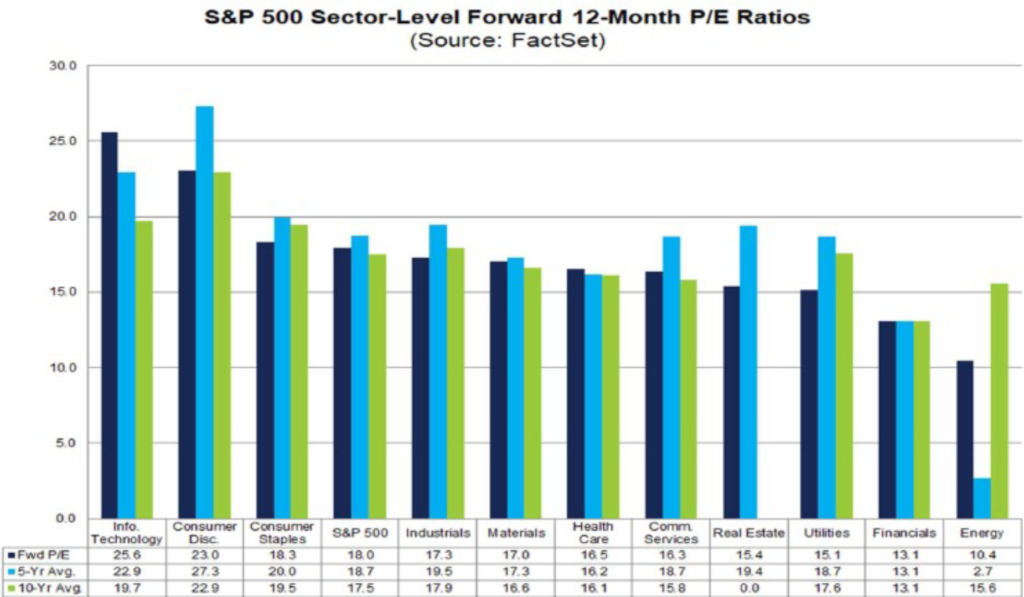
 Solyco Wealth early in 2024 continued to pivot its model portfolio holdings and thus, client investments, toward assets that will benefit from falling inflation and declining interest rates amidst moderating domestic economic growth. With an intense valuation focus defining our investment process, for much of 2023 holdings in client portfolios reflected a contrarian viewpoint, which substantially carried over to 2024. As frequently happens when we find ourselves in positions juxtaposed with market actions, we asked, “Are we wrong?” With a wealth of economic and earnings data already produced thus far this year, we conclude that “we’re not wrong; we’re just not right, yet.” Trying to get closer to “right” faster, we recently made the following adjustments to the sector weightings that inform our individual equity selections as compared to those of the benchmark S&P 500:

 Significant price appreciation for risk assets through 4Q23 solidly benefited Solyco Wealth’s four model portfolios as well as its investors. The four models averaged a 6.88% return for 4Q23, contributing to an average full-year 2023 total return of 17.87% for the portfolios, each of which holds a mix of individual stocks and debt Exchange Traded Funds (ETFs). As shown in the following table and as one would expect, the Solyco Wealth Aggressive Model Portfolio led the way with an 8.05% 4Q23 positive return and a 27.63% full-year 2023 total return. All four of the model portfolios also posted positive total returns since their September 8, 2021, inception despite the predominantly negative performances for risk assets in 2022. Notably, the Aggressive model accomplished these returns with 15% of its assets allocated to fixed income ETFs and 5% dedicated to cash. Also of note, we present all of our model portfolio performance statistics, which we generated using Morningstar Direct, net of the 1% management fee we charge clients.


 We borrowed an adage from Dwight D. Eisenhower to explain the financial planning and investment philosophies we expected to pursue when we launched Solyco Wealth:
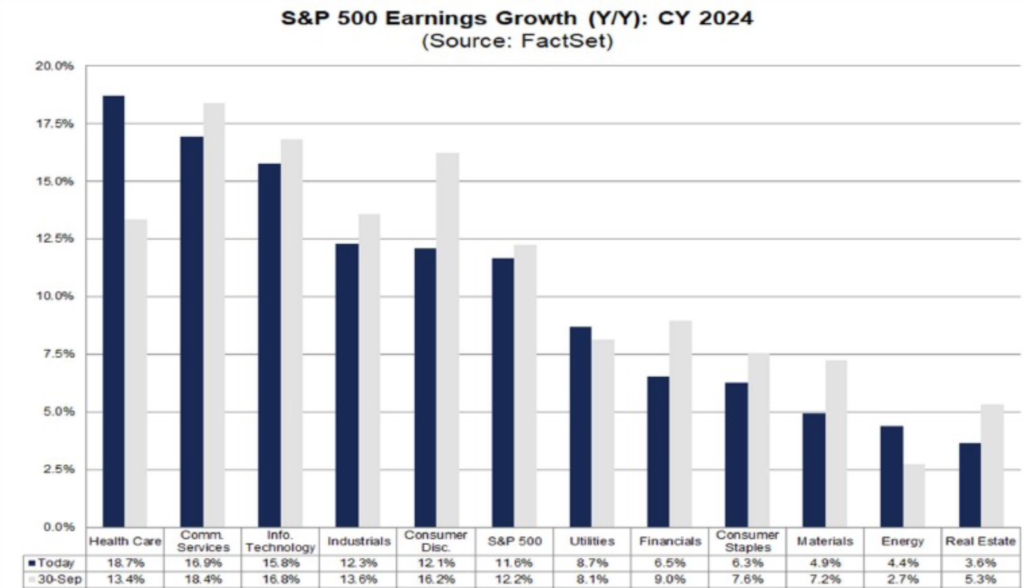

 Positive impact from 3Q23 mergers and acquisitions activities significantly affected Solyco Wealth’s Aggressive Model Portfolio. Permian Resources (PR) bid for portfolio holding Earthstone Energy (ESTE) resulted in a 35.1% uplift over the quarter, while Cisco Systems’ offer for co-holding Splunk (SPLK) saw its shares move 38.2% higher in 3Q23. Notably, Aggressive held a double-weight, 6% position in ESTE shares as compared to the typical 3% weighting for individual equity positions in the portfolio. These positive forces propelled the Aggressive Model Portfolio 2.5% higher for the quarter and 18.8% thus far in 2023, after fees, leading to respective outperformances of 5.9% and 8.5% vs. the S&P 500’s 3.2% loss for 3Q23 and 10.0% gain thus far in 2023.


 It’s no secret to active investors that the 10 largest US stocks dominated market returns in 1H23. The following chart provided by AllianceBernstein with data assists from FactSet and Standard & Poor’s, details exactly to what degree these 10 companies drove the S&P 500’s 16.9% 1H23 total return. Notably, six of the 10 are Tech stocks while Amazon and Tesla fall into Consumer Discretionary and Alphabet and Meta reside in the Communication Services sector. Outperformance in 4Q23 and in 2024 probably will require investors to add some breadth to their holdings beyond these companies and sectors, possibly well beyond them.
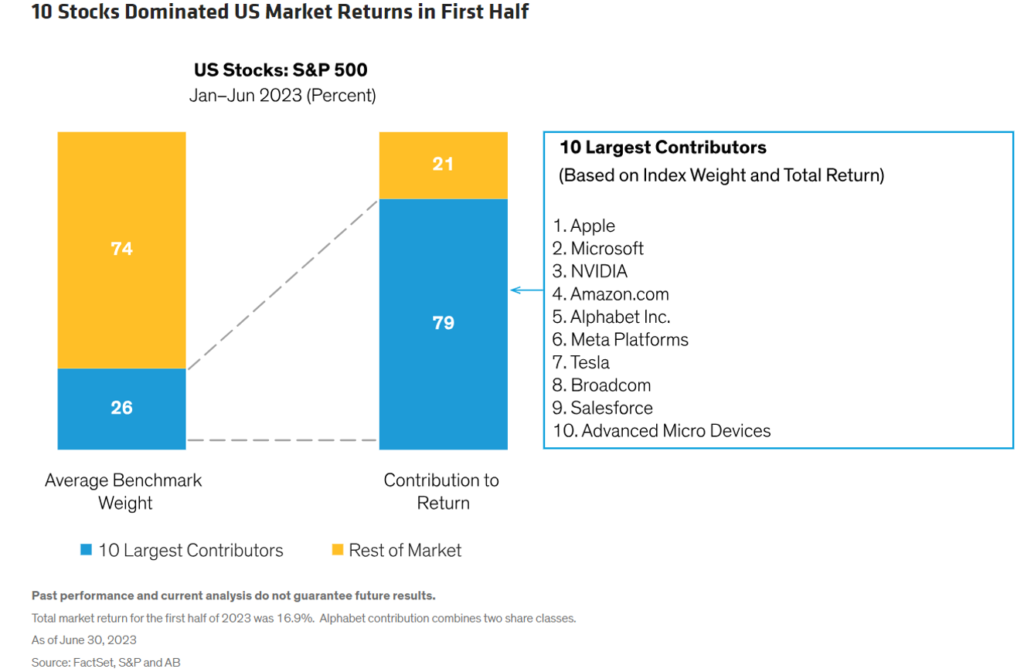
 Exiting 2Q23 earnings season Solyco Wealth commenced pivoted client portfolios to take advantage of higher bond yields with less susceptibility to equity volatility and credit risk. While it increasingly appears that the US will forego a recession in 2023 – the Atlanta Fed’s recent GDPNow estimate pointed to 5.8% 3Q23 GDP growth! (see below) – we harbor no expectation that equity markets will reward such lofty economic performance. Rather, we anticipate that any incremental economic strength will be met, at least, with hawkish Fed rhetoric and, more likely, future increases in the Fed Fund Rate. With real yields of 2%+ now available with little duration risk, we choose to increase by a combined 10% short-term Treasury and corporate debt exposure while reducing stock ownership by 10% for our three more aggressive model portfolios.
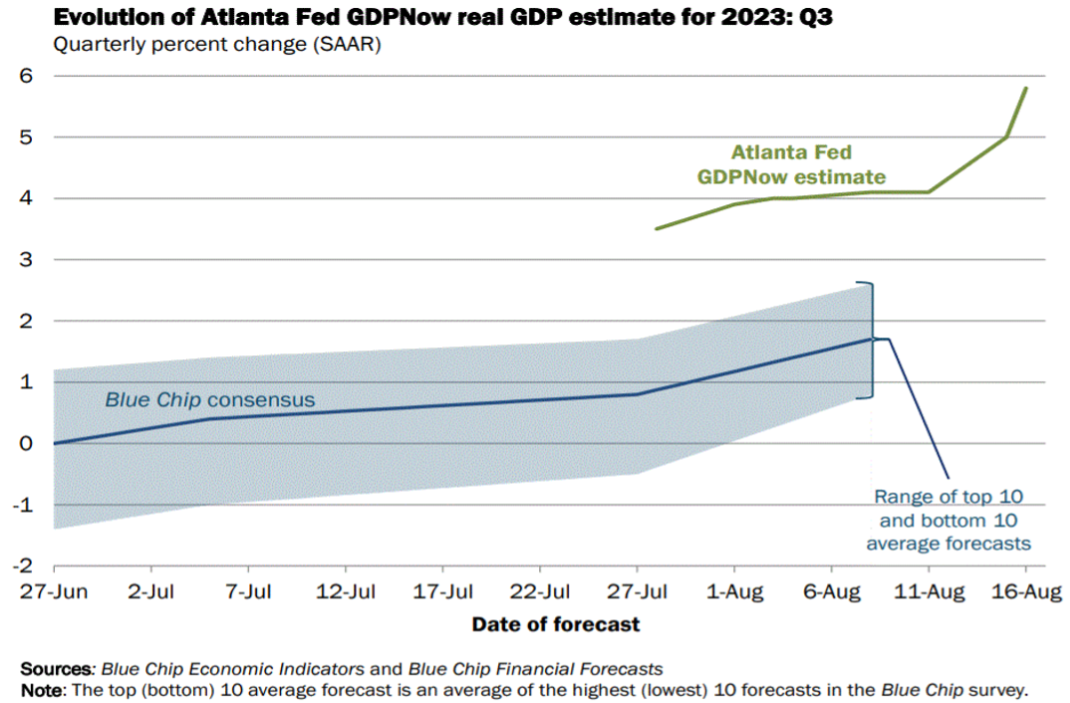


 Benefiting from rising equity values in 2Q23, Solyco Wealth’s four Model Portfolios posted an average return for the past quarter of +4.78%, ranging from +3.14% for the Conservative Model Portfolio to +6.68% for the Aggressive Model Portfolio. Alas, as each of our four portfolios not only retained fixed income and cash allocations but also substantially diversified equity holdings across the eleven S&P sectors, each of the Model Portfolios failed to keep pace with the S&P 500’s blistering 8.70% 2Q23 return.


 The stratospheric rise of the stock price for graphics chipset pioneer NVIDIA (NVDA) and other artificial intelligence (AI) participants invokes more than a few thoughts of asset-price bubbles. As Wharton Professor Jeremy Siegel recently noted in commentary on the subject, “momentum can carry stocks far higher than their fundamental value, and no one can predict how high they might go.” We argue that price appreciation far above a company’s fundamental value hardly warrants being labeled a “bubble.” Appreciation of 160% in less than six months, however, warrants heightened scrutiny.