2023 Investing Views from Solyco Wealth
 The investment climate in 2023 likely will reflect a tale of two halves. Through the first two quarters of the year, we anticipate ongoing discussions of inflation, Fed interest rate policy, and stalling economies to dominate the investing landscape, much as they did throughout last year. The second half of 2023, however, we envision that abating inflationary pressures will lead to fading concerns for higher interest rates and more constructive thoughts of economic recovery and growth.
We possess little certainty about the magnitude for any of the above conditions, however, but expect directionality will rule the day rather than absolute movements. As a result, we expect investing successes in 2023 will hinge heavily on securities selection. The retail sector already offers an excellent example of the probable difficulties posed to investors this year and the prospective benefits of holding the right assets. Whereas American Eagle (AEI) and Urban Outfitters (URBN) reported record 2022 holiday sales with better-than-anticipated margins that recently bolstered their share prices, Macy’s (M) and Lululemon (LULU) experienced fine rates of sales growth but apparently of discounted items that negatively impacted margins and, thus, their share prices. We are fairly certain that specificity likely will matter more for investing success in 2023 than in prior years.
Earnings season for 4Q22 kicks off later this week with Delta (DAL), which Solyco Wealth includes in its model portfolios and client accounts, joining several of the large money-center banks like JPMorgan (JPM) and Bank of America (BAC). We should get very quick reads of the strength of the US consumer via credit card and consumer lending data from the banks as well as travel-and-leisure booking trends from DAL. We expect banks’ views on consumer strength to remain modestly positive but with a decidedly stronger optimistic bias for their travel-and-leisure budgets. Overall through 4Q22 earnings season, however, we would not be surprised to hear a healthy degree of “sandbagging” from company management teams with respect to their earnings and cash flow expectations for 2023.
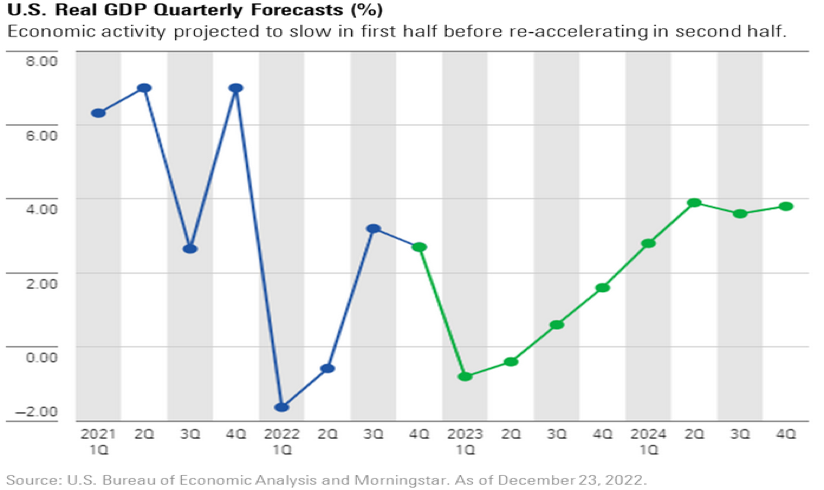
Driving our cherry-picked example just a little further, this investor also could have benefited from repurchasing the same 1,000 SLB shares four months later at $33. To maintain the symmetry to our example, they also recently reestablished their 133-share MSFT position at $244. So, our investor now not only retains the same 1,000 shares of SLB and 133 shares of MSFT, For one thing, as the above graph from Morningstar relays, expectations for 1Q23 economic growth remain anemic. With a backdrop of such low expectations for the economy and “margin pressure” like that experienced by Macy’s and Lululemon all but omnipresent, it probably will prove too attractive for all but the most bullish (or bad) of public company management teams to not take the opportunity to lower the bar of investor expectations. Some companies will need to do this as their businesses actually are flagging. Others, however, will do it just because they can (aka “sandbagging”). Environments like the current one that likely lead to wide-spread sandbagging of expectations all too often see companies segmented into three types of opportunities:
- Strong buys for companies with excellent and/or opportunistic leaderships that proactively managed inventories to maintain margins with solid views on the direction of their operations in ’23 that, therefore, do not need to sandbag. We think Delta falls into this category for 4Q22/2023.
- Speculative buys or holds for companies that post solid 4Q22 results but that fail to exhibit much knowledge regarding the directionality of their businesses in 2023.
- Strong avoids for companies that blame exogenous factors for underwhelming 4Q22 results coupled with little insight as to what 2023 may hold for them, their company, or their employees.
As analysts aggressively reduced their 4Q22 earnings estimates (see graph below) we expect a healthy “beat rate” for the quarter. According to FactSet analysts overall cut their S&P 500 earnings projections by 6.5% since 3Q22, a rate 1.5x that of the average decrease over the past 20 years.
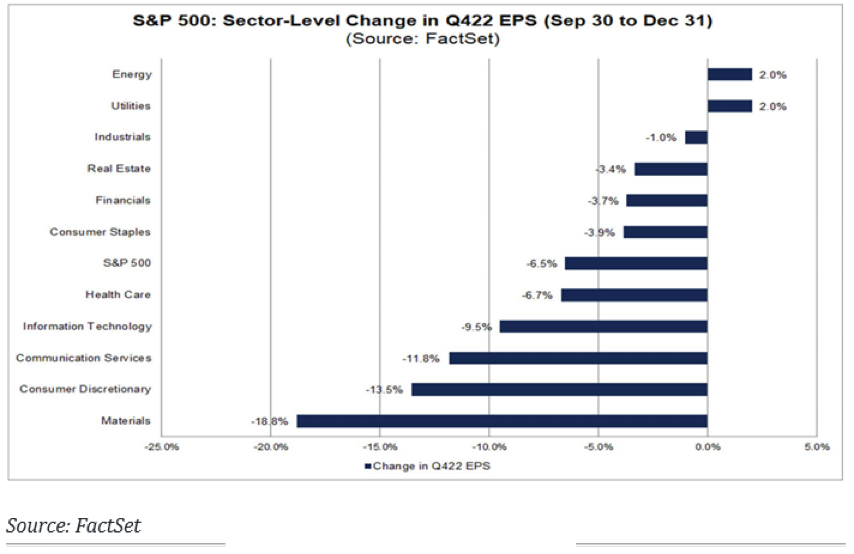
Earnings expectations for 2023 – the crux of our “sandbagging” claim – call for 4.8% growth for the S&P 500 versus 2022 earnings. By comparison S&P 500 earnings in 2022 exceeded those of 2021 by 4.7%. The likes of Macy’s and Lululemon will need to see some extensive inventory turnover early in ’23 to realize margin recoveries sufficient for this year’s earnings growth to exceed that of last year; we expect more than a few companies will be in similar positions with even more posting declining margins due to wage pressures. Also, the Energy sector appears highly unlikely to generate earnings growth this year comparable to what it did last year without crude oil prices staging a significant rebound from their recent $75 per barrel level. Due to recession and economic growth concerns and their estimated impact on crude oil demand, barring another unforeseen shock to crude oil supply we do not see this price appreciation occurring until 2H23. The necessary downward revisions to 2023 earnings estimates probably materialize (the lowering of the bar) with analysts’s 4Q22 reports, creating the proverbial “low bar” for much of 2023. Given very low expectations for equities late in 2022 and very high levels of ongoing uncertainty for 2023 operating conditions, little motivation existed for analysts to make these reductions prior to 4Q22 reporting season.
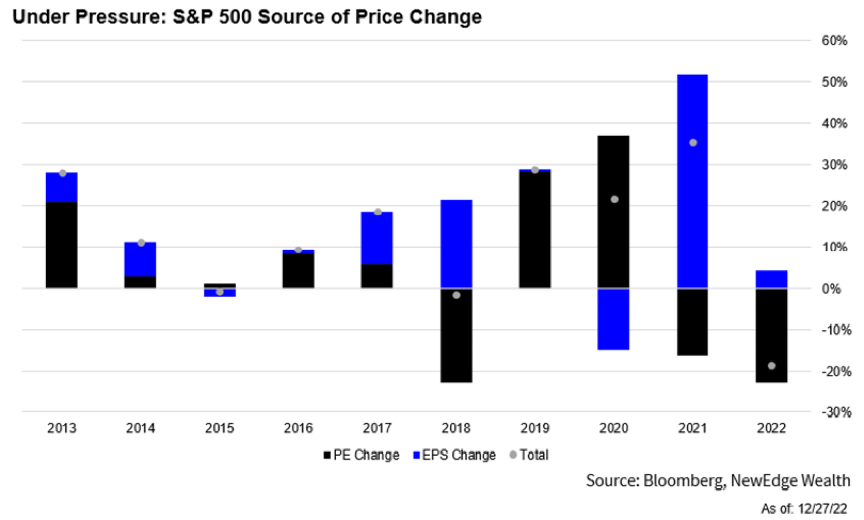
Despite our expectations for muted 1H23 earnings growth, we remain constructive on equities this year. Stock prices trade in response to future expectations and 2H23 offers immense opportunities for equities to clear the low bar of expectations set early in 2023. As shown in the following graph, the challenging investing environment in 2022 developed not in response to poor earnings, which likely grew 4.8%, but rather to investors substantially discounting those growing earnings. As a result, the price-to-earnings ratio for the S&P 500 fell to 18.6x at year-end 2022 a level 24.4% lower than 2021’s year-end P/E of 24.6x in spite of the aforementioned earnings growth.
Rapidly escalating interest rates – a key component of companies’ cost of capital, or discount rates – at the hands of the Fed in response to even more rapidly escalating inflation explained this significant discounting of S&P 500 earnings. As shown in the table below, which reflects a stream of cash flows discounted in perpetuity at the stated rate, a 24.2% decline in P/E implies a 31.8% relative increase in a company’s discount rate: 10% to 13.2%, for instance. In other words, $20 of cash flow in 2021 is only worth $15.17 in 2022, irrespective of whether or not the company needed more or less capital to generate that cash flow. While we anticipate higher costs of capital persisting through 2023 and into 2024, the above graph of P/Es – albeit through environment with much lower and less volatile interest rates – exhibits the more or less whimsical nature of the relationship between prices and earnings. In our view it probably will not take much evidence of moderating interest rate increases for investors to begin propelling P/Es higher in response to prospectively lower estimated costs of capital. We point to the number and strength of 2022’s “bear market rallies” in support of this conclusion as well as to the magnitude of cash sitting on the sidelines (discussed below).
| Discount Rate | 10.0% | 11.0% | 12.0% | 13.0% | 13.2% | 14.0% | 15.0% | 16.0% | 17.0% |
| Implied Change in Value | -9.1% | -16.7% | -23.1% | -24.1% | -28.6% | -33.3% | -37.5% | -41.2% | |
| % Change in Discount Rate | 10.0% | 20.0% | 30.0% | 31.8% | 40.0% | 50.0% | 60.0% | 70.0% |
Source: Solyco Wealth
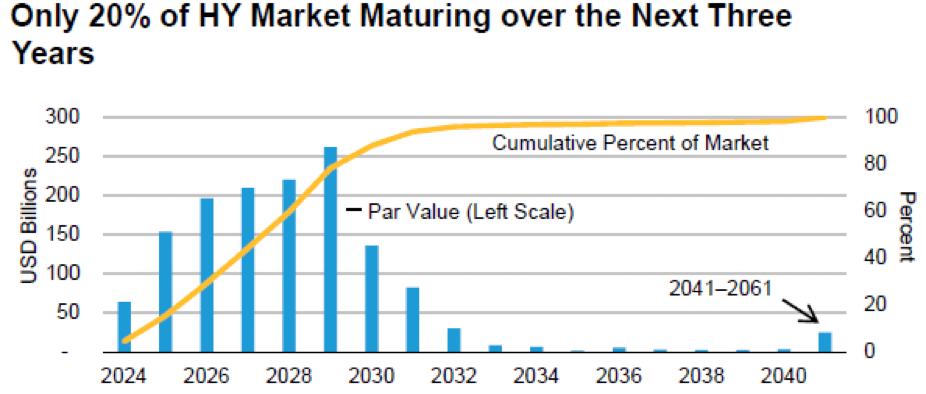
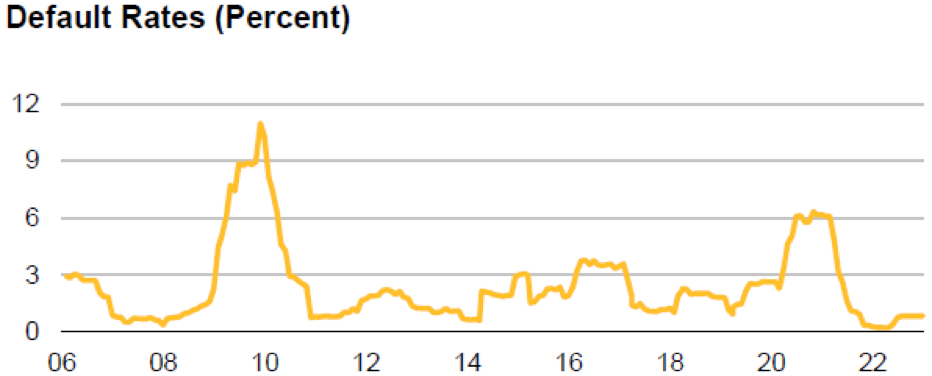
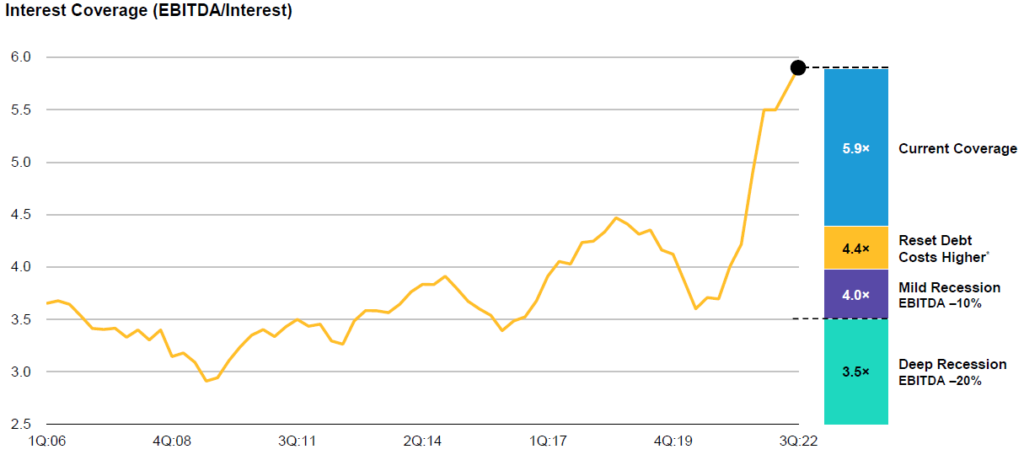
The three graphs below, which convey the percentage of high-yield, or junk, debt coming due over the next three years, the recent default rate of high-yield issuers, and the recent rate of interest coverage for these issuers, exhibit the cumulative capital situation for the subset of companies most sensitive to changes in the cost of capital. Overall, despite the very negative environment in 2022 and the significant economic uncertainty entering 2023, it appears that the companies most susceptible to a rising cost of capital environment remain in a relatively strong position. Sentiment, which we judge whimsical by nature, appears to be the primary driver of this increase in cost of capital and not fundamental demand for additional capital.
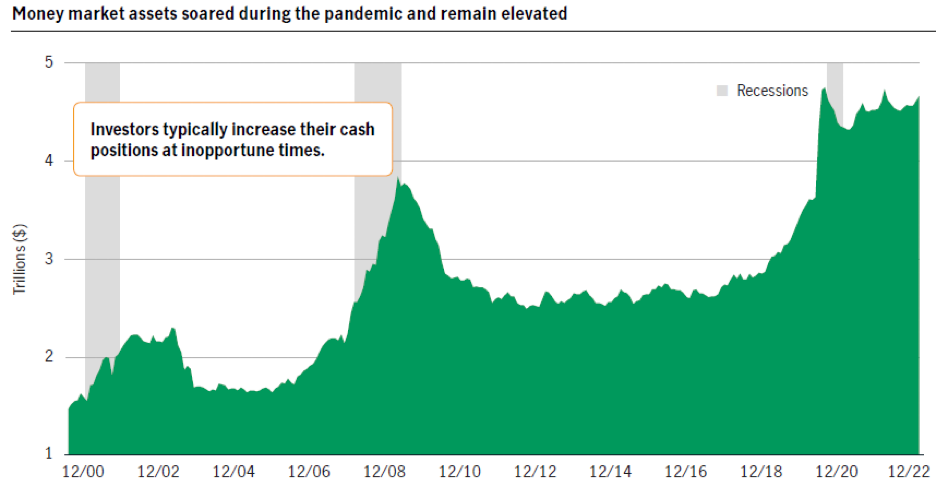
Substantial cash on the sidelines waiting for the “all clear” signal to deploy fulfills the final cog underpinning a constructive backdrop for risk assets in 2023, in our view. FactSet data, as presented in the following graph, calculated approximately $4.5 trillion in money market accounts exiting 2022. These money market balances represent about 13.8% of the total $32.5 trillion market capitalization of the S&P 500. Deployment of this magnitude of available capital and the positive momentum created would, in our view, signal the “all clear” and mark a persistent reversal of investor sentiment.
Solyco Wealth allocates assets to equity, fixed income and cash across four risk gradients ranging from Conservative to Aggressive using a model portfolio concept. While equity allocations to these four model portfolios range from 25% for the Conservative portfolio to 90% for the Aggressive portfolio, Fixed Income allocations span 5% for Aggressive to 65% for Conservative. The Cash allocation amounts to 10% for the three most conservative portfolios while the Aggressive portfolio maintains a 5% cash position.
| Risk Tolerance | Equity | Fixed Income | Cash | Total |
| Conservative | 25.0% | 65.0% | 10.0% | 100.0% |
| Moderate | 45.0% | 45.0% | 10.0% | 100.0% |
| Moderately Aggressive | 65.0% | 25.0% | 10.0% | 100.0% |
| Aggressive | 90.0% | 5.0% | 5.0% | 100.0% |
While we anticipate that the pace and magnitude of increases in the Fed Funds Rate will slow significantly in the coming months, we expect to maintain our Fixed Income allocations through at least 1Q23. For the most conservative portfolios we likely will pull cash allocations down to 5% in favor of heavier weightings to Fixed Income rather than change the portfolios’ equity allocations. Notably, we achieve all of Solyco Wealth’s Fixed Income exposures by investing in Exchange Traded Funds (ETFs) and not in individual bonds.
Within the Fixed Income allocations, we continue to favor shorter duration securities. The outsized volatility at the long-end of the interest rate curve remains a concern to us vis-à-vis the relatively short period and magnitude of declines in the inflation numbers. We favor, as a result, greater equity exposure over long-duration fixed income assets. We also employ a decided preference for Credit and Municipals exposures over Treasuries.
As for equity exposure for our four model portfolios, Solyco Wealth invests in shares of individual companies. We continue to favor the Industrials and Materials sectors, as we have since mid-October 2022, while underweighting Information Technology and avoiding Utilities altogether, as shown in the following table.
| Equity Sector | Rating | S&P 500 Weighting | Solyco Wealth Weighting | Difference |
| Communications Services | Equalweight | 7.5% | 7.5% | 0.0% |
| Consumer Discretionary | Equalweight | 11.3% | 11.3% | 0.0% |
| Consumer Staples | Equalweight | 6.1% | 6.1% | 0.1% |
| Energy | Equalweight | 5.3% | 5.3% | 0.0% |
| Financials | Equalweight | 11.7% | 11.7% | 0.0% |
| Health Care | Equalweight | 14.7% | 14.7% | 0.0% |
| Industrials | Overweight | 9.1% | 13.7% | 4.6% |
| Information Technology | Underweight | 25.5% | 21.1% | -4.4% |
| Materials | Overweight | 2.8% | 5.6% | 2.8% |
| Real Estate | Equalweight | 3.2% | 3.0% | -0.2% |
| Utilities | Underweight | 2.9% | 0.0% | -2.9% |
| 100.0% | 100.0% | 0.0% |
Providing that economic growth rekindles and increases in interest rates cease as we expect by 2H23, we anticipate opportunities to upgrade the pro-cyclical sectors Consumer Discretionary and Information Technology to Overweights. In order to fund these moves we likely would move Consumer Staples to an Underweight rating and Industrials and Materials back to Equalweights. Energy represents a significant “wildcard” for 2023, in our view, as it hinges heavily on crude oil demand which we anticipate will swing wildly in response to Ukraine-Russia and geopolitical developments as well as to global economic growth (or the lack thereof).
Asset class allocation and sector weightings offer valuable buffers against portfolio underperformance. However, in our view, picking equities that offer compelling risk-reward ratios represents the best protection from lagging performance. We spend an inordinate amount of time pouring over equity research, company news flows and financials, and relevant sector, industry, and geopolitical commentaries, from a wide variety of sources. In our view these efforts in combination with a significant amount of successful investing experience across a broad array of market conditions give Solyco Wealth “the edge” many firms lack. Below we offer the stocks, grouped by sector, that compose the current equity holdings of our four model portfolios:
Consumer Discretionary: Amazon (AMZN), Borg-Warner (BWA), Mercadolibre (MELI), Nike (NKE), Texas Roadhouse (TXRH), YETI (YETI)
Consumer Staples: Anheuser-Busch (BUD), Boston Beer (SAM), Performance Food Group (PFGC), Wal-Mart (WMT)
Energy: Earthstone Energy (ESTE), Pioneer Natural Resources (PXD), Totalenergies (TTE)
Financials: CBOE Global Markets (CBOE), Citizens Financial Group (CFG), Chubb (CB), Goldman Sachs (GS), Intercontinental Exchange (ICE), Traveler’s (TRV)
Health Care: Abbot Labs (ABT), Biontech (BNTX), Boston Scientific (BSX), Centene (CNC), CVS (CVS), Incyte (INCY), Johnson & Johnson (JNJ), Nuvasive (NUVA), Universal Health Services (UHS), Zimmer Biomed (ZBH)
Industrials: ABB (ABB), Chart Industries (GTLS), Delta (DAL), Honeywell (HON), Lockheed-Martin (LMT), WESCO (WCC)
Information Technology: Applied Materials (AMAT), Advanced Micro Devices (AMD), Autodesk (ADSK), Arista Networks (ANET), Cisco (CSCO), Corning (GLW), MicroChip (MCHP), Microsoft (MSFT), Salesforce (CRM), ServiceNow (NOW), Shopify (SHOP), Splunk (SPLK),
Materials: Eastman Chemical (EMN), Sociedad Quimica y Minera (SQM)
Real Estate: American Tower (AMT)
Utilities: No Holdings
The above companies represent the entirety of the equity positions across all four Solyco Wealth model portfolios: no portfolio holds each of these stocks. In our view the risk-reward ratio offered by YETI, for instance, is inappropriate for the Conservative portfolio vis-à-vis that of Nike. Generally, our portfolios hold between one and seven Fixed Income ETFs and between 24 and 32 individual equities. We desire to manage relatively concentrated positions as we only want to hold securities in which we harbor great conviction. Looking forward we anticipate that from the above list DAL, ESTE, GTLS, SHOP and SQM, may offer the most compelling risk-reward characteristics in 2023. Conversely, ABT, NKE, UHS, and TXRH, currently trade the closest to the upper bounds of our valuation estimates, barring upside from 4Q22 performance and/or escalating expectations for 2023. We remain happy to share our individual models and securities allocations with anyone interested upon request.