Solyco Wealth Model Portfolios Substantially Outperform Benchmarks, S&P 500 in 4Q22 and 2022
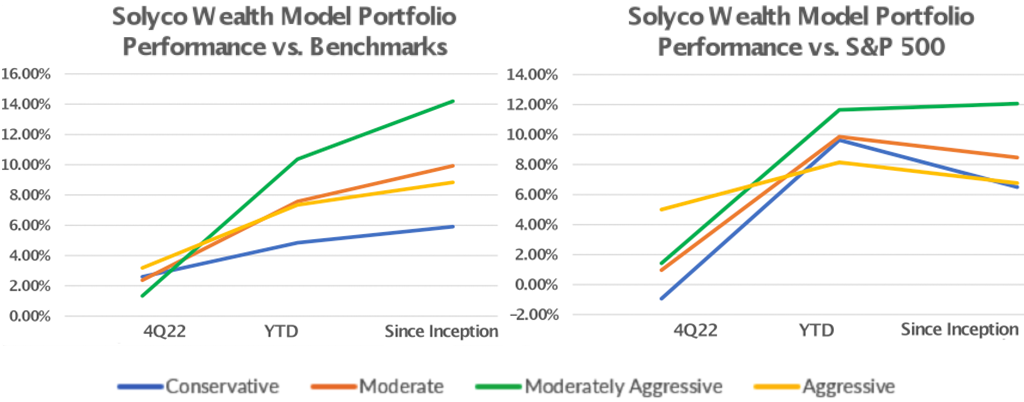
 The four model portfolios managed by Solyco Wealth generated relatively very strong performances for 4Q22, full-year 2022, and since their September 8, 2021, inception, as shown in the charts below. Except the performance of the Conservative Model Portfolio in 4Q22 vs. the S&P 500, each of the portfolios’ performances exceeded that of its benchmark as well as that of the S&P 500 and Bloomberg US Aggregate Bond Index. Since inception the Conservative, Moderate, Moderately Aggressive and Aggressive Model Portfolios averaged 9.72% of out-performance versus their respective benchmarks and 8.45% out-performance versus the S&P 500.
Stock-picking remained the key strength underpinning the success of Solyco Wealth as across all portfolios equity out-performance averaged exceeding that of the S&P 500 by 11.34%, or 1,134 basis points (bps). Meanwhile, out-performance of the fixed income exchange traded funds (ETFs) held in the model portfolios only averaged 0.84%, or 84 bps. As a matter of investment policy, Solyco Wealth populates its model portfolios with individual equities while allocating capital to bond ETFs to achieve the desired fixed income weighting. The four portfolios hold between 25 and 30 stocks of individual companies and two to seven bond ETFs. The three more conservative portfolios also utilize the common stocks of private debt providers Ares Capital (ARCC) and Hercules Technology (HTGC) to achieve diversified fixed income exposures.
Conservative Model Portfolio
As shown in the following table, the Conservative model portfolio posted a positive 6.62% result for 4Q22 but dropped 8.48% in 2022 and 6.78% since inception. These results outpaced Conservative’s benchmark by 260 bps in 4Q22, 484 bps in 2022, and 591 bps SI. Solyco Wealth runs the Conservative Model Portfolio with a 65% allocation to fixed income securities, a 22.8% domestic equity securities allocation, a 2.2% international equity securities allocation, and a 10% cash position. The Conservative portfolio benefited from out-performance from both its equity and fixed income allocations as performances to each of these asset class allocations outdistanced those of the S&P 500 and the Bloomberg US Aggregate Bond Index. By design the Conservative Model Portfolio under-weighted international equities throughout 2022 in anticipation of greater worldwide volatility relative to that of the US. Although this positioning served the portfolios well last year, we anticipate it reversing and will commence to adding more international exposure with subsequent portfolio changes.
| Solyco Wealth Conservative Model Portfolio Comparative Performance: 4Q22, 2022, and Since Inception | ||||
| 4Q22 | 2022 | Since SW Inception | ||
| Benchmarks | S&P 500 | 7.56% | -18.11% | -13.28% |
| Russell 3000 | 7.18% | -19.21% | -15.69% | |
| MSCI All-World ex-US | 16.18% | -14.29% | -15.68% | |
| Bloomberg US Agg Bond | 0.72% | -12.46% | -12.95% | |
| Conservate Model Portfolio | Portfolio Return | 6.62% | -8.48% | -6.78% |
| Benchmark Return | 4.02% | -13.32% | -12.69% | |
| +/- Benchmark | 2.60% | 4.84% | 5.91% | |
| +/- S&P 500 | -0.94% | 9.63% | 6.50% | |
| +/- Equities vs. S&P 500 | 8.23% | 9.48% | 11.00% | |
| +/- Fixed Income vs. Agg | 1.47% | 2.09% | 2.18% | |
The above table reflects a 1% annual management fee for 2022 as well as 0.25% for 4Q22 and 1.33% since exception.
Actual client investment performance likely will differ from respective model portfolio performance due to several factors including: 1) Timing of securities purchases and sales, 2) Dividend reinvestment choices, 3) Securities held outside the model portfolio, 4) Weighting differentials for certain securities relating to whole versus partial share accounting, 5) Timing and pricing of rebalancing actions, and other minor factors.
Conservative benchmark = total returns for 10.0% Russell 3000 Index, 65.0% Bloomberg US Aggregate Bond Index, and 10.0% MSCI World ex-US Index and 15.0% cash allocations.
Energy and Defense propelled Conservative’s results, led by SLB’s +84.1% return since inception as well as TotalEnergies (TTE) 50.8% move higher and Lockheed Martin’s (LMT) 44.1% rate of appreciation for the same time period. From the fixed income side Ares Capital (ARCC), in which the portfolio carries a 5% weighting, generated a +5.3%, over 1,800 bps better than the fixed income benchmark.
On the downside Conservative suffered significantly from a 25.1% move lower for the Vanguard Emerging Markets Government Bond ETF (VWOB) prior to removing it from the portfolio in 3Q22. In fact, fixed income ETFs defined six of the seven worst performing assets held in the portfolio. Amazon (AMZN), falling 52.1% SI, provided the stiffest headwind for Conservative’s performance, followed by Alphabet’s (GOOGL) 38.9% drop and the 38.9% decline in Comcast’s stock price since portfolio inception.
Moderate Model Portfolio
With a returns profile of +8.53% for 4Q22, -8.25% for 2022, and -4.81% SI, Solyco Wealth’s Moderate Model Portfolio exceeded benchmark performances respectively by 237 bps, 757 bps, and 992 bps. The Moderate portfolio carried a 52% weighting to equities along with a 38% bond allocation and a 10% cash position. As Moderate’s fixed income holdings only outperformed the -14.73% performance of the benchmark by 35 bps, equity holdings that outpaced the S&P 500 by 13.09% SI drove portfolio outperformance.
| Solyco Wealth Conservative Model Portfolio Comparative Performance: 4Q22, 2022, and Since Inception | ||||
| 4Q22 | 2022 | Since SW Inception | ||
| Benchmarks | S&P 500 | 7.56% | -18.11% | -13.28% |
| Russell 3000 | 7.18% | -19.21% | -15.69% | |
| MSCI All-World ex-US | 16.18% | -14.29% | -15.68% | |
| Bloomberg US Agg Bond | 0.72% | -12.46% | -12.95% | |
| Moderate Model Portfolio | Portfolio Return | 8.53% | -8.25% | -4.81% |
| Benchmark Return | 6.16% | -15.82% | -14.73% | |
| +/- Benchmark | 2.37% | 7.57% | 9.92% | |
| +/- S&P 500 | 0.97% | 9.86% | 8.47% | |
| +/- Equities vs. S&P 500 | 7.85% | 10.68% | 13.09% | |
| +/- Fixed Income vs. Agg | 1.35% | 0.71% | 0.35% | |
The above table reflects a 1% annual management fee for 2022 as well as 0.25% for 4Q22 and 1.33% since exception.
Actual client investment performance likely will differ from respective model portfolio performance due to several factors including: 1) Timing of securities purchases and sales, 2) Dividend reinvestment choices, 3) Securities held outside the model portfolio, 4) Weighting differentials for certain securities relating to whole versus partial share accounting, 5) Timing and pricing of rebalancing actions, and other minor factors.
Moderate benchmark = total returns for 22.5% Russell 3000 Index, 45.0% Bloomberg US Aggregate Bond Index, and 22.5% MSCI World ex-US Index, and 10.0% cash allocations.
As with the Conservative Model Portfolio, Moderate’s Energy holdings paced performance. SLB moved 84.1% while held in the portfolio while Pioneer Natural Resources (PXD), which remains a 1.73% weighting, appreciated 75.2% SI. Health care companies Vertex Pharmaceuticals (VRTX) and AbbVie (ABBV) were sold out of the portfolio at respective gains of 63.5% and 49.7%.
The 25.1% move lower for the Vanguard Emerging Markets Government Bond ETF (VWOB), Amazon’s (AMZN) 52.1% decline, and entertainment company Paramount’s (PARA) 53.5% move lower disproportionately detracted from Moderate’s performance. Twelve positions were sold out of Moderate since inception, including four at a loss. Centene (CNC) was sold and subsequently repurchased in exchange for VRTX.
Moderately Aggressive Model Portfolio
Solyco Wealth’s Moderately Aggressive Model Portfolio remained the firm’s top-performing portfolio as it gained 8.98% for 4Q22, reducing its 2022 loss to 6.46% and its fall since inception to only 1.22%. These results exceeded those of the S&P 500 by 142 bps for 4Q22, 1,165 bps for full-year 2022, and 1,206 bps since its 9/8/21 inception. Moderately Aggressive deploys 65% of its capital to equities with 25% allocated to debt ETFs, and 10% reserved in cash. As compared to the blended benchmark, which equally splits its equity allocation with 32.5% allocated to domestic and to international stocks, we underweighted international equities throughout 2022. As shown in the following table, equity performance accounted for the vast majority of the portfolio’s out-performance.
| Solyco Wealth Moderately Aggressive Model Portfolio Comparative Performance: 4Q22, 2022, and Since Inception | ||||
| 4Q22 | 2022 | Since SW Inception | ||
| Benchmarks | S&P 500 | 7.56% | -18.11% | -13.28% |
| Russell 3000 | 7.18% | -19.21% | -15.69% | |
| MSCI All-World ex-US | 16.18% | -14.29% | -15.68% | |
| Bloomberg US Agg Bond | 0.72% | -12.46% | -12.95% | |
| Moderate Model Portfolio | Portfolio Return | 8.98% | -6.46% | -1.22% |
| Benchmark Return | 7.65% | -16.83% | -15.42% | |
| +/- Benchmark | 1.33% | 10.37% | 14.20% | |
| +/- S&P 500 | 1.42% | 11.65% | 12.06% | |
| +/- Equities vs. S&P 500 | 4.80% | 11.42% | 14.04% | |
| +/- Fixed Income vs. Agg | 1.22% | 2.60% | 2.30% | |
The above table reflects a 1% annual management fee for 2022 as well as 0.25% for 4Q22 and 1.33% since exception.
Actual client investment performance likely will differ from respective model portfolio performance due to several factors including: 1) Timing of securities purchases and sales, 2) Dividend reinvestment choices, 3) Securities held outside the model portfolio, 4) Weighting differentials for certain securities relating to whole versus partial share accounting, 5) Timing and pricing of rebalancing actions, and other minor factors.
Moderately Aggressive benchmark = total returns for 32.5% Russell 3000 Index, 25.0% Bloomberg US Aggregate Bond Index, and 32.5% MSCI World ex-US Index, and 10.0% cash allocations.
Out-performing Energy stocks SLB and Pioneer Natural Resources (PXD) were joined by Chilean lithium and minerals miner Sociedad de Quimica y Minera (SQM) in aiding Moderately Aggressive’s since-inception performance as SQM shares appreciated 64.0% over that period of time. As with the more conservatively managed portfolios, Health Care entities VRTX, ABBV, and CNC (which we sold and repurchased) joined Energy and SQM to benefit the portfolio. Unfortunately, significant downside moves from AMZN, PARA, CMCSA,and cloud computing concern ServiceNow (NOW), among others more than offset positive contributions and led to the portfolio’s 122 bps loss since inception. Interestingly, Moderately Aggressive, despite the prevailingly negative investing environment, saw almost as many positive (21) contributions as negative headwinds (24) from the 45 positions held by the portfolio since its inception.
Aggressive Model Portfolio
Despite posting the strongest finish to 2022 of Solyco Wealth’s four model portfolios, up 12.56% for 4Q22, the firm’s Aggressive Model Portfolio defined its worst offering for 2022 (-9.96%) and since inception (-6.52%). The increased small-cap exposure of Aggressive explains much of this relative under-performance as 2022 proved to be a horrid year for small-cap stocks, especially small-cap growth equities. Aggressive, as its name implies, hinges substantially on equity performance as that asset class composes 90% of the portfolio’s holdings. Debt ETFs make up 5% of the portfolio with the 5% balance allocated to cash. While the worst-performing of Solyco Wealth’s model portfolios, Aggressive still handily out-performed both its blended benchmark as well as the S&P 500 across 4Q22, 2022, and since-inception, time periods, as shown in the following table.
| Solyco Wealth Aggressive Model Portfolio Comparative Performance: 4Q22, 2022, and Since Inception | ||||
| 4Q22 | 2022 | Since SW Inception | ||
| Benchmarks | S&P 500 | 7.56% | -18.11% | -13.28% |
| Russell 3000 | 7.18% | -19.21% | -15.69% | |
| MSCI All-World ex-US | 16.18% | -14.29% | -15.68% | |
| Bloomberg US Agg Bond | 0.72% | -12.46% | -12.95% | |
| Moderate Model Portfolio | Portfolio Return | 12.56% | -9.96% | -6.52% |
| Benchmark Return | 9.40% | -17.32% | -15.35% | |
| +/- Benchmark | 3.18% | 7.34% | 8.83% | |
| +/- S&P 500 | 5.00% | 8.15% | 6.76% | |
| +/- Equities vs. S&P 500 | 6.83% | 8.16% | 7.23% | |
| +/- Fixed Income vs. Agg | 2.07% | -1.24% | -1.48% | |
The above table reflects a 1% annual management fee for 2022 as well as 0.25% for 4Q22 and 1.33% since exception.
Actual client investment performance likely will differ from respective model portfolio performance due to several factors including: 1) Timing of securities purchases and sales, 2) Dividend reinvestment choices, 3) Securities held outside the model portfolio, 4) Weighting differentials for certain securities relating to whole versus partial share accounting, 5) Timing and pricing of rebalancing actions, and other minor factors.
Aggregate benchmark = total returns for 45% Russell 3000 Index, 5.0% Bloomberg US Aggregate Bond Index, 45% MSCI World ex-US Index, and 5.0% cash allocations.
Small-cap oil and gas producer Earthstone Energy (ESTE) joined SLB and SQM among Aggressive’s best-performing positions, joined by CNC and VRTX from the Health Care sector and Deere & Co. (DE) and Performance Food Group (PFGC) from the respective universes of Industrial and Consumer Staples companies. The out-sized positive contributions from DE and PFGC prove doubly notable as they represented 2H22 additions that generated significantly positive impacts (+32.6% and +28.3%, respectively) in relatively very short periods of time.
Shopify (SHOP), an e-commerce services provider that dropped over 70% in 2022, and consumer products company YETI, which experienced a 57.5% decline in its stock price since portfolio inception, defined Aggressive two worst-performing holdings. Joining them were PARA, CMCSA, and NOW, which we also hold in other portfolios. Chart Industries (GTLS), which engineers and manufactures equipment for Energy and Industrial concerns, presented Aggressive with a significant conundrum late in 2022 as its very positive absolute performance for the first nine months of the year gave way to a 40% share price drop by year-end due to a very, very poorly received acquisition management announced in 4Q22. We retain GTLS in the portfolio, however, as we view the concerns surrounding the transaction of less long-term impact than the potential cash flow accretion of the combination. Similarly, we continue to hold SHOP shares due to their long-term prospects.